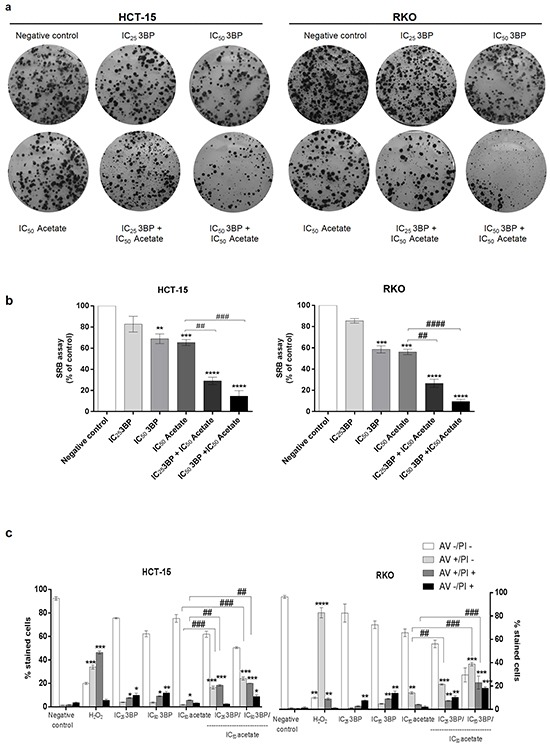
Figure 7. Effect of acetate with 3-bromopyruvate (3BP; a glycolysis inhibitor) in CRC cells.

a, b and c. CRC cells were treated with IC25 and IC50 values for the 3BP (17.5 uM, 35 uM and 75 uM, 150 uM, respectively for HCT-15 and RKO cells). The treatments were performed with 3BP alone or with acetate treatment combination (only the IC50 value for the acetate: 70 mM for HCT-15 and 110 mM for RKO cell line) after 48 h of incubation. 3BP was added 16 hours before to complete 48 hours of the treatment. As negative control, cells were treated with fresh medium. H2O2 (500 uM or 1 mM for HCT-15 or RKO cell lines, respectively) was used as positive control. a. Colony formation assay during 14 days shows that the combined treatment (IC25 of 3BP/IC50 of acetate and IC50 of3BP/IC50 of acetate) decreases cell proliferation (number of colony formed at the end of the assay) in both CRC cell lines in a dose-dependent manner compared to the negative control and with the same dose of the 3BP or acetate alone. b. Sulforhodamine B (SRB) assay analyzes the cell proliferation of the same conditions. Values represent mean ± SD of at least three independent experiments. **P ≤ 0.01, ***P ≤ 0.001 and ***P ≤ 0.0001 compared with negative control cells and ## P ≤ 0.01 and #### P ≤ 0.0001 comparing acetate alone with combined treatment (IC25 of 3BP/IC50 of acetate and IC50 of3BP/IC50 of acetate). c. Quantitative analysis of AV/PI staining in HCT-15 and RKO cells. Values represent mean ± SD (AV – PI -, AV + PI -, AV + PI + and AV – PI +) of each condition (n=3). *P ≤ 0.05, **P ≤ 0.01, ***P ≤ 0.001 and ***P ≤ 0.0001 compared with negative control cells and ## P ≤ 0.01 and #### P ≤ 0.0001 comparing acetate alone with combined treatment (IC25 of 3BP/IC50 of acetate and IC50 of3BP/IC50 of acetate).
