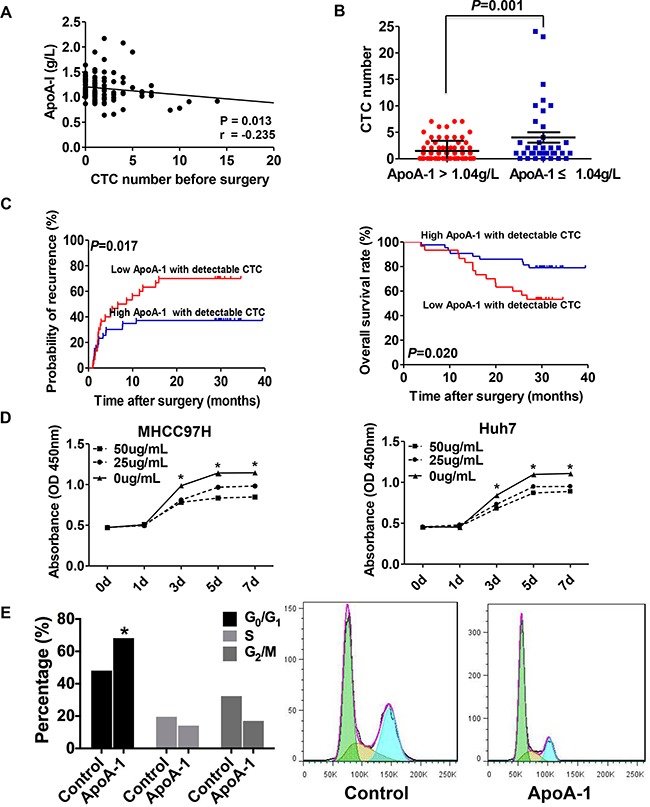
Figure 3. Correlation between serum ApoA-1 levels and CTC.

A. Correlation between serum ApoA-1 levels and the number of CTCs. B. CTC-positive rates of HCC patients with different serum ApoA-1 levels. C. The Kaplan–Meier analysis of TTR (left) and OS (right) for serum ApoA-1 levels in patients with detectable CTC. D. Cell viability was significantly inhibited by 25 or 50 ug/mL ApoA-1 compared with control group in MHCC97H (left) and Huh7 (right) cell lines. E. ApoA-1 treatment could effectively result in G0/G1 arrest in MHCC97H. “*” indicated P < 0.05.
