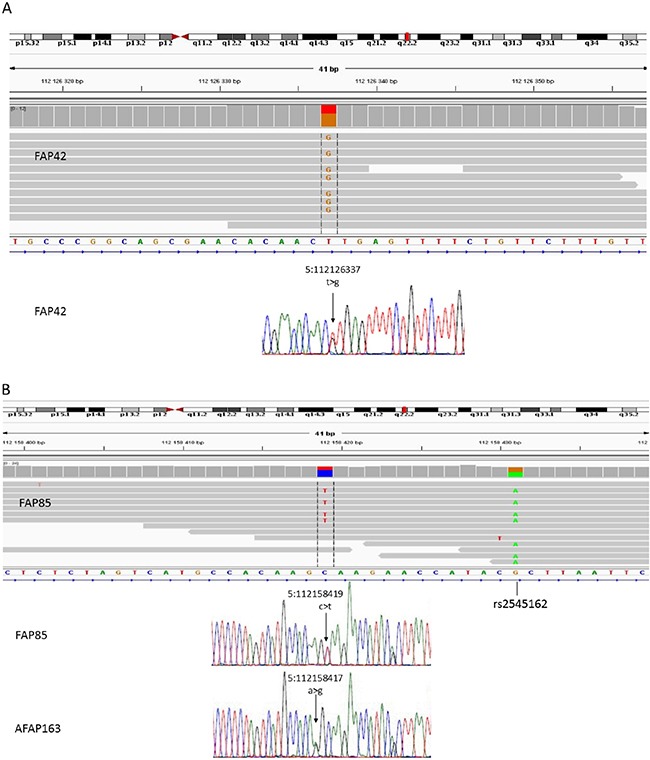
Figure 4. WGS (42 and 85-2) + Sanger seq.

Deep intronic mutations in APC. Upper panels provide IGV display of WGS data for intron 6 in FAP42 (Figure 4A) and intron 11 in FAP85, individual 85-2 (Figure 4B). Lower panels show Sanger sequence tracings of the mutations. In Figure 4B, the Sanger sequencing result of AFAP163 is also given (AFAP163 was not included in WGS analysis).
