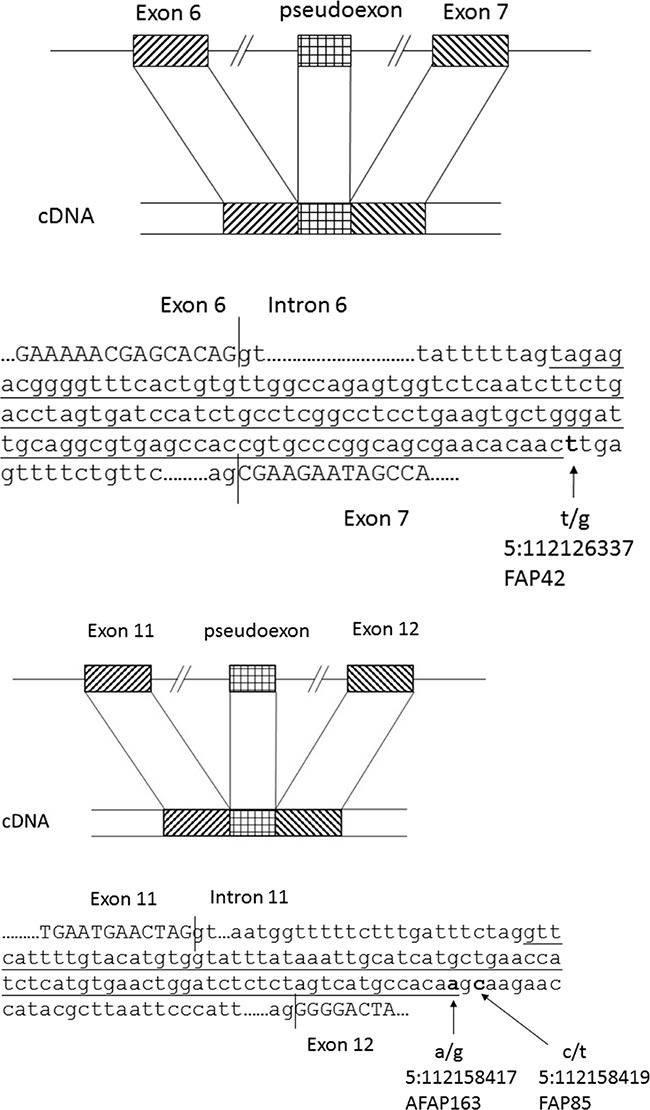
Figure 5. Schematic diagrams of pseudoexons.

Schematic diagrams of APC pseudoexons identified. The canonical splice sites at the exon/intron borders, pseudoexons (underlined), and the responsible deep intronic mutations (in bold) are highlighted.

Schematic diagrams of APC pseudoexons identified. The canonical splice sites at the exon/intron borders, pseudoexons (underlined), and the responsible deep intronic mutations (in bold) are highlighted.