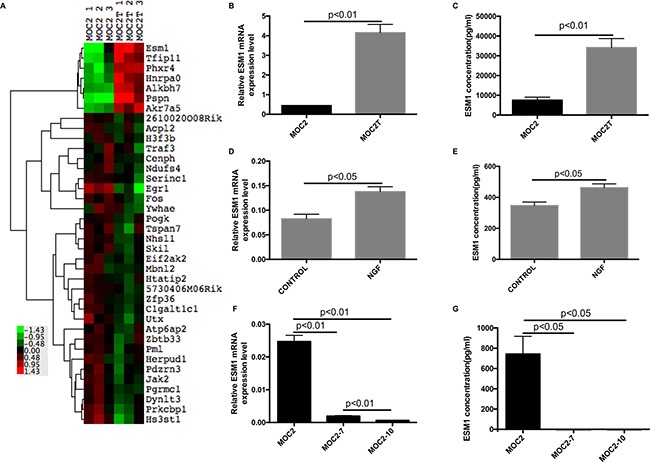
Figure 3. NGFR regulates expression of ESM1.

A. Heat map of hierarchical clustering analysis of differentially expressed genes in MOC2 cells and MOC2 cells that overexpress NGFR (MOC2T), selected at p≤0.05 followed by 2-fold cutoff change. Each column represents data from a single cohort with shades of red and green indicating up- or down- regulated genes according to the color scheme shown beside. B, C. ESM1 mRNA expression, assessed by qRT-PCR, and ESM1 soluble protein expression, assessed by ELISA, in MOC2 and MOC2T cells. Data represent the mean±SEM. D, E. ESM1 mRNA expression, assessed by qRT-PCR, and ESM1 soluble protein expression, assessed by ELISA, in MOC2 cells that were incubated in vitro with or without 100 ng/ml recombinant human NGF for 24 hours. Data represent the mean±SEM. F, G. Transcriptional expression of ESM1 mRNA, assessed by qRT-PCR, and ESM1 soluble protein expression, assessed by ELISA, in mouse oral squamous cell lines-MOC2, MOC2-7 and MOC2-10. Data represent the mean±SEM. The qRT-PCR results are presented as units defined as the n-fold difference relative to the control gene HPRT1.
