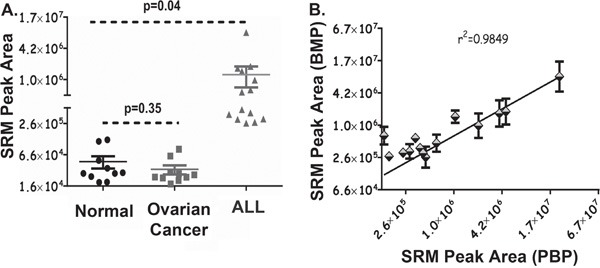
Figure 4. AEP activity in Human Plasma Collected from Normal and Diseased Individuals.

A. 25 μl of peripheral blood plasma samples (pH 5.8) from 10 healthy normal and 10 patients with ovarian cancer plus bone marrow plasma from 14 patients with ALL were measured for AEP activity using the assay developed. Samples were incubated with 4 mM AEP synthetic substrate at 37°C for 16 hr. Reactions were stopped by adding 2 volume of ACN. Enriched pool of small peptides was dried and resuspended in LB. Samples were analysed by the SRM-MS workflow. SRM peak area represents AEP activity in the plasma. Error bars shown are +/−SD. B. AEP activity was measured in 14 matched peripheral (PBP) and bone marrow (BMP) plasma samples collected from childhood patients diagnosed with ALL. 25 μl of plasma samples were used and pH was adjusted to 5.8. Samples were incubated with 4mM AEP synthetic substrate at 37°C for 16 hr, followed by protein precipitation using 2 volume of ACN. Enriched pool of small peptides was dried and reconstituted in LB. Samples were analysed by the SRM-MS workflow. SRM peak area for peripheral and bone marrow plasma is representative of AEP activity in respective samples. Error bars shown are +/−SD.
