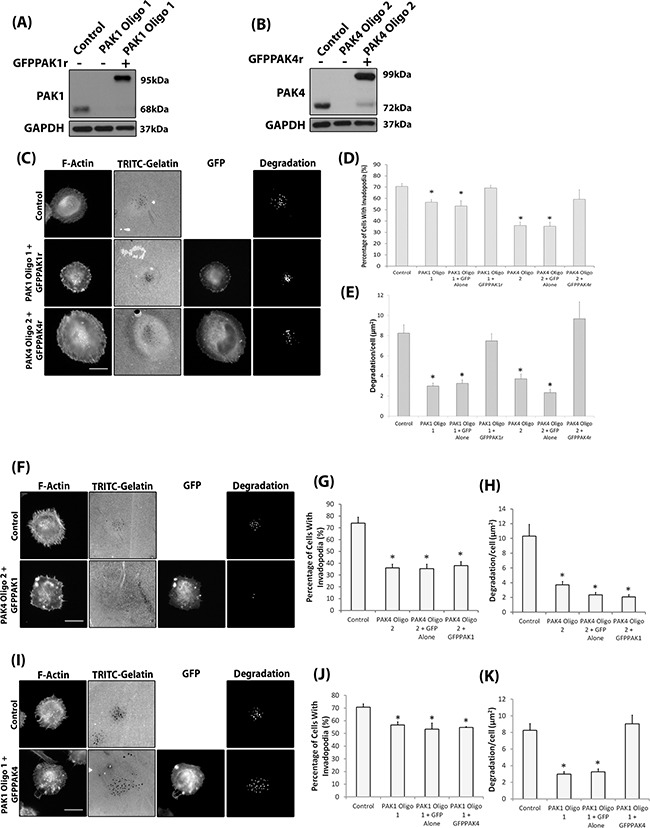
Figure 5. Isoform specific PAK1 and PAK4 functions during the invadopodia lifecycle.

A-B. Confirmation of siRNA resistant protein expression in PAK1 (A) or PAK4 (B) siRNA depleted WM-115 cells. C. Representative invadopodia assay images of WM-115 depleted cells transfected with GFPPAK1r or GFPPAK4r. Scale bars = 10μm. D. The percentage of cells with invadopodia and E. the area of degradation from invadopodia. Significance was calculated to control siRNA transfected cells of 150 (Percentage) or 90 (Degradation) cells, over 3 independent experiments; * = P 00< 0.05. F. Representative invadopodia assay images of WM-115 PAK4 knockdown cells transfected with GFP alone or GFPPAK1. Scale bars = 10μm. G. The percentage of cells with invadopodia. Significance was calculated to control siRNA transfected cells. 150 cells, over 3 independent experiments; * = P 00< 0.05. H. The area of degradation from invadopodia per cell. Significance was calculated to control siRNA transfected cells. 90 invadopodia producing cells, over 3 independent experiments; * = P 00< 0.05. Control = cells transfected with non-specific siRNA. I. Representative invadopodia assay images of WM-115 PAK1 knockdown cells transfected with GFP alone or GFPPAK4. Scale bars = 10μm. J. The percentage of cells with invadopodia. Significance was calculated to control siRNA transfected cells. 150 cells, over 3 independent experiments; * = P 00< 0.05. K. The area of degradation from invadopodia per cell. Significance was calculated to control siRNA transfected cells. 90 invadopodia producing cells, over 3 independent experiments; * = P 00< 0.05. Control = cells transfected with non-specific siRNA. In all cases data are mean values ± S.E.M
