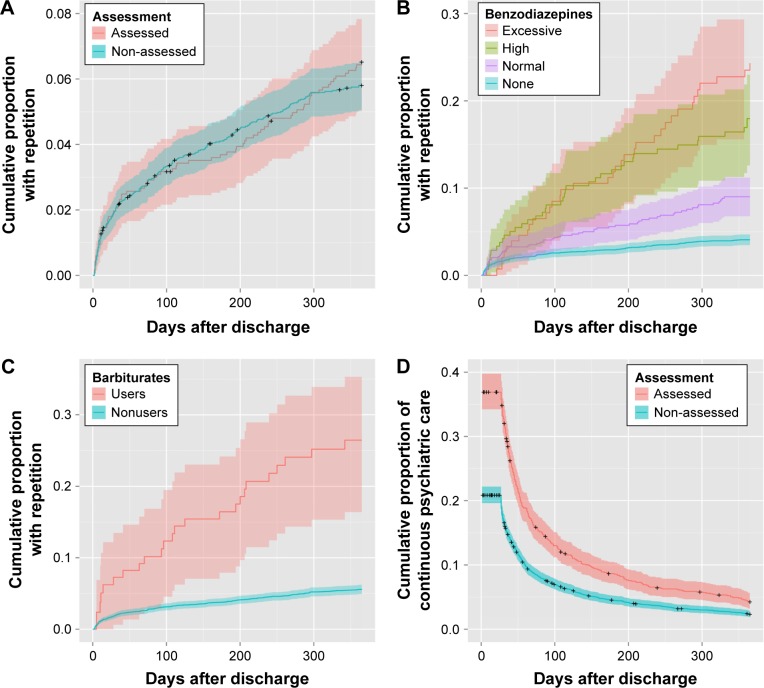
Figure 2.
Cumulative proportion of primary and secondary outcomes by treatment patterns before and after discharge in the no-psychiatrist cohort (n=4,950).
Notes: Solid line represents Kaplan–Meier event curve, and shaded area represents the 95% confidence interval. (A) Overdose repetition by psychosocial assessment, (B) overdose repetition by benzodiazepine prescription, (C) overdose repetition by barbiturate prescription, and (D) continuity of psychiatric care by psychosocial assessment.

