
Figure 2.
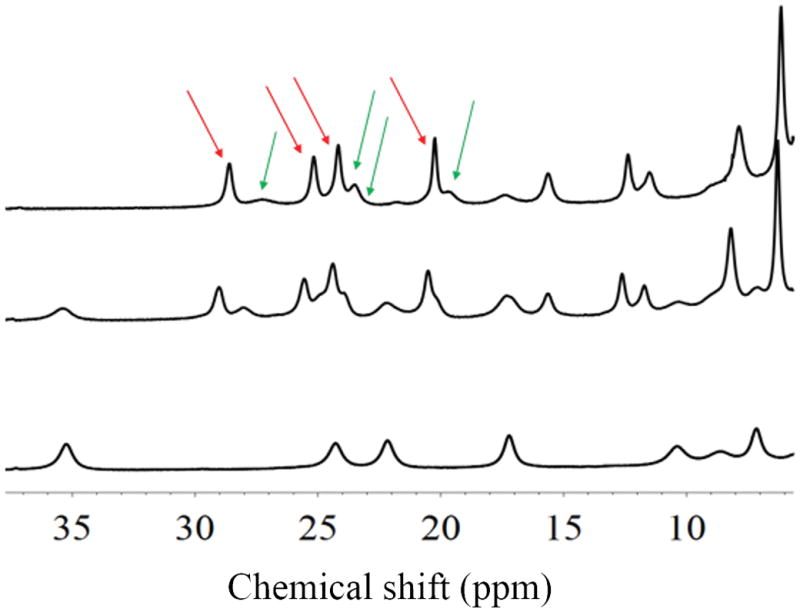
1H NMR spectra of an aqueous solution (pD=8.0, 277K) containing 50 mM EuDO3A (bottom), 50 mM EuDO3A plus 50 mM lactate (middle), and 50 mM EuDO3A plus 2 M lactate (top). The red and green arrows reflect the H4 resonances of two different lactate•EuDO3A species.