
Figure 6.
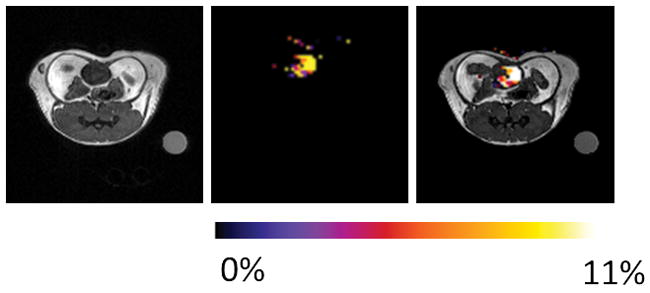
Axial proton MRI, CEST image, and overlay image of a mouse after IV injection of 0.105 mmol/kg EuDO3A and lactate. The CEST image of the bladder shows that the intact lactate•EuDO3A complex is present at 45 min after iv injection (n=3). The CEST image represents amplitude differences between images collected after a 14 μT pre-saturation pulse of 5 s duration at ±43 ppm.