
Fig. 2. Optimization of the sweat control and characterization of individual sensors.
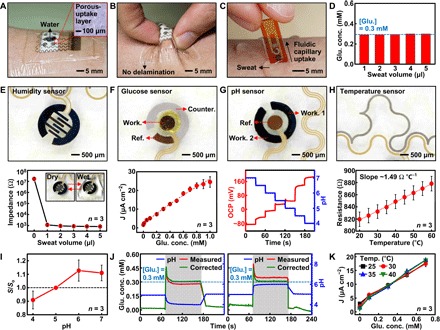
(A) Optical image of the wearable sweat analysis patch with a sweat-uptake layer and a waterproof band. The inset shows the magnified view of the porous sweat-uptake layer. (B) Optical image of the sweat analysis patch under deformation. (C) Optical image of the disposable sweat analysis strip on human skin with perspiration. (D) Glucose (glu.) concentration measurement at different sweat volumes (0.3 mM glucose in artificial sweat). (E) Optical image (top) and calibration curve (bottom) of the humidity sensor. Inset shows the image before and after wetting of the sensor. (F) Optical image (top) and calibration curve (bottom) of the glucose sensor. (G) Optical image (top) and calibration curve (bottom) of the pH sensor. (H) Optical image (top) and calibration curve (bottom) of the temperature sensor. (I) Changes of the relative sensitivity of the uncorrected glucose sensor at different pH levels. The relative sensitivity (S/So) is defined as measured sensitivity divided by sensitivity at pH 5. (J) In vitro monitoring of glucose changes with (green) and without (red) correction using simultaneous pH measurements (blue). (K) Calibration curves of the glucose sensor at different temperatures.