
Fig. 4. Sweat-based glucose monitoring and feedback therapy in vivo.
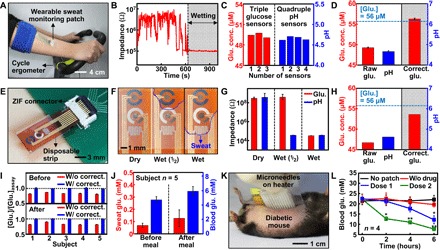
(A) Optical camera image of the subject using a cycle ergometer for sweat generation with the wearable patch on the subject’s arm. (B) Real-time humidity monitoring to check the accumulation of sweat. (C) Multimodal glucose and pH sensing to improve detection accuracy. (D) Measured sweat glucose concentrations (n = 3), pH levels (n = 4), and corrected sweat glucose level (n = 3) based on the averaged pH (dotted line, glucose concentration measured by a commercial glucose assay). (E) Optical camera image of the disposable strip-type sensors connected to a zero insertion force (ZIF) connector. (F) Optical camera images of the sweat uptake via the fluidic channel of the strip. (G) Humidity monitoring of the disposable strip using impedance measurements. (H) Sweat glucose and pH monitoring using the disposable strip. (I) Ratio of sweat glucose concentrations (n = 3) measured by the patch and a commercial glucose assay with and without the pH-based correction before and after a meal. (J) Comparison of the sweat and blood glucose concentrations before and after a meal. (K) Optical camera image of the transdermal drug delivery device on the db/db mouse. (L) Blood glucose levels of the db/db mice for the treated groups (microneedles with the drugs) and control groups (without the patch, microneedle without the drugs) (*P < 0.05, **P < 0.01 versus control, Student’s t test).