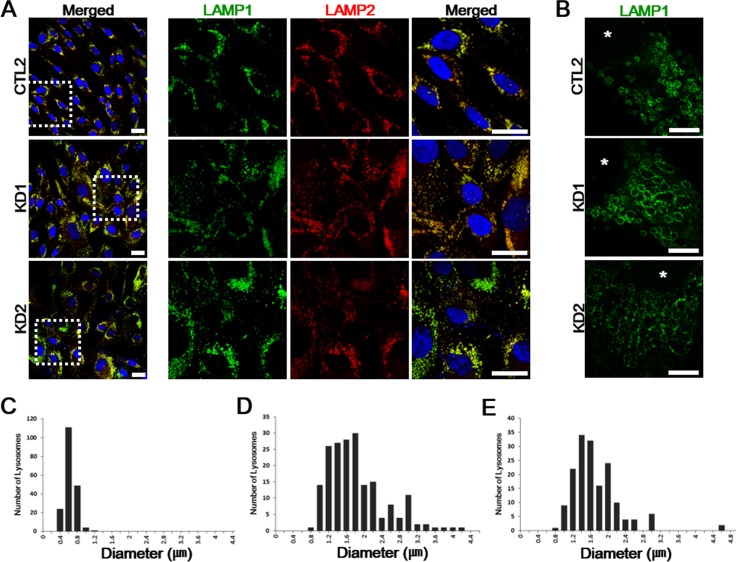
Figure 2. Immunofluorescent analysis of the fibroblast cultures from the KD patients.
A. Control and both KD1 and KD2 fibroblasts were fixed, permeabilized, and stained. LAMP1 (green) and LAMP2 (red) are both expressed higher in the patients compared to a representative healthy control fibroblasts. Enlarged images of the regions highlighted by dashed white squares in merged images (left) are in the right columns. DNA is identified by DAPI. Scale bars: 25 μm. B. Representative STED images of LAMP1 morphology differences in healthy controls and KD fibroblasts. LAMP1 morphologies are altered with enlarged and fragmented LAMP1-positive vesicles. Nuclei are indicated by asterisks (*). Scale bars: 5 μm. C.-E. The increased distribution ranges of lysosome diameters in patient fibroblasts (D, KD1: range, 0.74-4.15 μm; E, KD2: range, 0.75-4.68 μm) compared to healthy control fibroblasts (C, CTL: range, 0.36-1.03 μm). For each plot, n = 20 cells.

