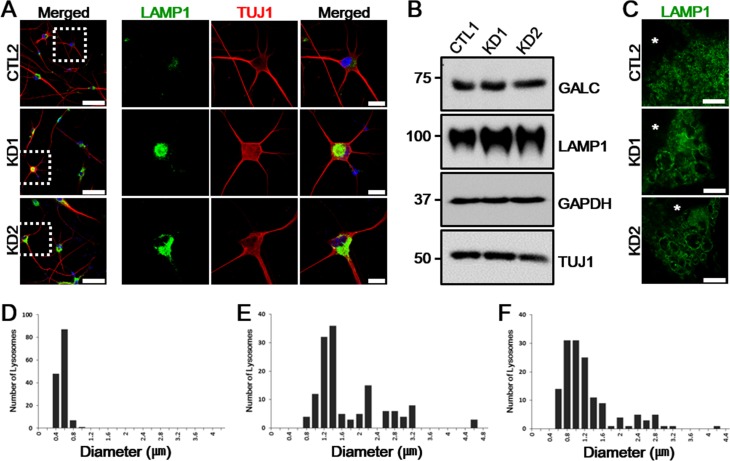
Figure 4. LAMP1 vesicles accumulate in KD iNeurons.
A. LAMP1 (green) expression is increased in patient iNeurons positive for TUJ1 (red). Enlarged images of the regions highlighted by dashed white squares in merged images (left) are in the right columns. DNA is identified by DAPI. Scale bars: 100 μm (enlarged images: 25 μm). B. Whole-cell protein extracts from a representative healthy control and patient iNeurons analyzed by immunoblotting show similar amount of GALC expression but the increase in LAMP1 was confirmed. GAPDH and TUJ1 are shown as loading controls (n = 4). C. Representative STED images of LAMP1 morphology differences in control and the two KD patient iNeurons. Alterations of LAMP1 morphologies are demonstrated with enlarged and irregularly shaped LAMP1-positive vesicles in KD iNeurons. Nuclei are indicated by asterisks (*). Scale bars: 5 μm. D.-F. The increased distribution ranges of lysosome diameters in KD iNeurons (E, KD1: range, 0.79-4.64 μm; F, KD2: range, 0.63-4.3 μm) compared to control iNeurons (D, CTL: range, 0.25-0.99 μm)). For each plot, n = 15 cells.

