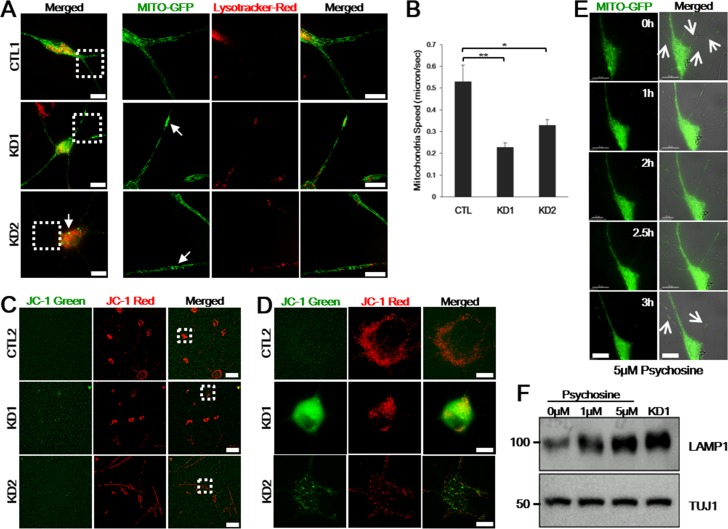
Figure 6. Psychosine induces lysosome accumulation, neurite and mitochondrial defects in control iNeurons.
A. Representative healthy control and KD iNeurons were transfected with Mito-GFP to visualize mitochondria and incubated with Lysotracker-Red to visualize lysosomes in live cells. The right panels represent zoomed images of the boxed areas on the left. Mito-GFP are distributed evenly throughout the dendrites in live control iNeurons, while those are swollen or accumulated in live KD iNeurons (arrows) (n = 7). Scale bars: 25 μm (zoomed images: 15 μm). B. Reduced moving speeds of mitochondria in patient iNeurons were measured using kymograph analysis. Moving speed is presented as means ± SEM, n = 80. One-way ANOVA followed by Tukey multiple comparisons test; *p < 0.05, **p < 0.001. C. JC-1 staining on live iNeurons from a representative control and the patients. Figure D. represents zoomed images of the boxed areas in C.. Control iNeurons have red fluorescence, sign of preserved mitochondrial membrane potential, whereas KD1 cells displayed strong green fluorescence and KD2 with weaker green fluorescence, sign of mitochondrial membrane depolarization (n = 5). Scale bars: 100 μm C., 15 μm D.. E. Images of live control iNeurons expressing Mito-GFP after 5 μM of psychosine treatment. Representative frames from time-lapse image series (0-3 h) are shown. Neurites are abolished and mitochondria are accumulated (arrows). The right panel is merged pictures of DIC and fluorescence images. Scale bars: 25 μm. F. Immunoblotting detection of LAMP1 and TUJ1 neuronal marker confirmed that psychosine accumulation in healthy control iNeurons triggers lysosomal accumulation in a dose-dependent manner. LAMP1 of endogenous KD iNeurons is also presented.

