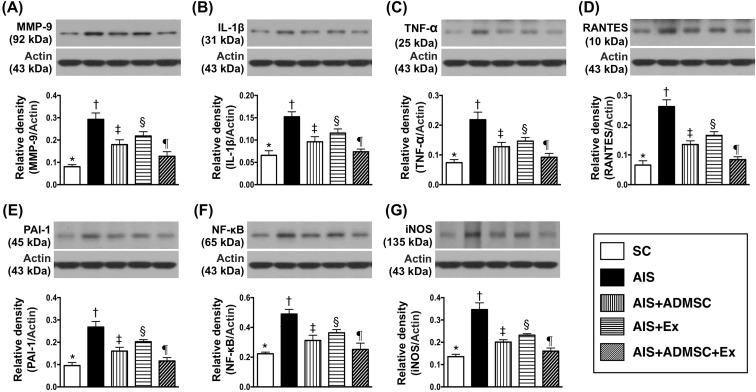
Figure 4. Protein expression of inflammatory biomarkers in brain infarct region by day 60 after AIS (n = 6).
A. Protein expression of matrix metalloproteinase (MM9-9), * vs. other groups with different symbols (†, ‡, §, ¶), p < 0.0001. B. Protein expression of interleukin (IL)-1β, * vs. other groups with different symbols (†, ‡, §, ¶), p < 0.0001. C. Protein expression of tumor necrosis factor (TNF)-α, * vs. other groups with different symbols (†, ‡, §, ¶), p < 0.0001. D. Protein expression of RANTES, * vs. other groups with different symbols (†, ‡, §, ¶), p < 0.0001. E. Protein expression of plasminogen activator inhibitor (PAI)-1, * vs. other groups with different symbols (†, ‡, §, ¶), p < 0.0001. F. Protein expression of nuclear factor (NF)- κB, * vs. other groups with different symbols (†, ‡, §, ¶), p < 0.0001. G. Protein expression of inducible nitric oxide synthase (iNOS), * vs. other groups with different symbols (†, ‡, §, ¶), p < 0.0001. All statistical analyses were performed by one-way ANOVA, followed by Bonferroni multiple comparison post hoc test. Symbols (*, †, ‡, §, ¶) indicate significance (at 0.05 level). SC = sham control; AIS = acute ischemic stroke; ADMSC = adipose-derived mesenchymal stem cell; Ex = exosome.

