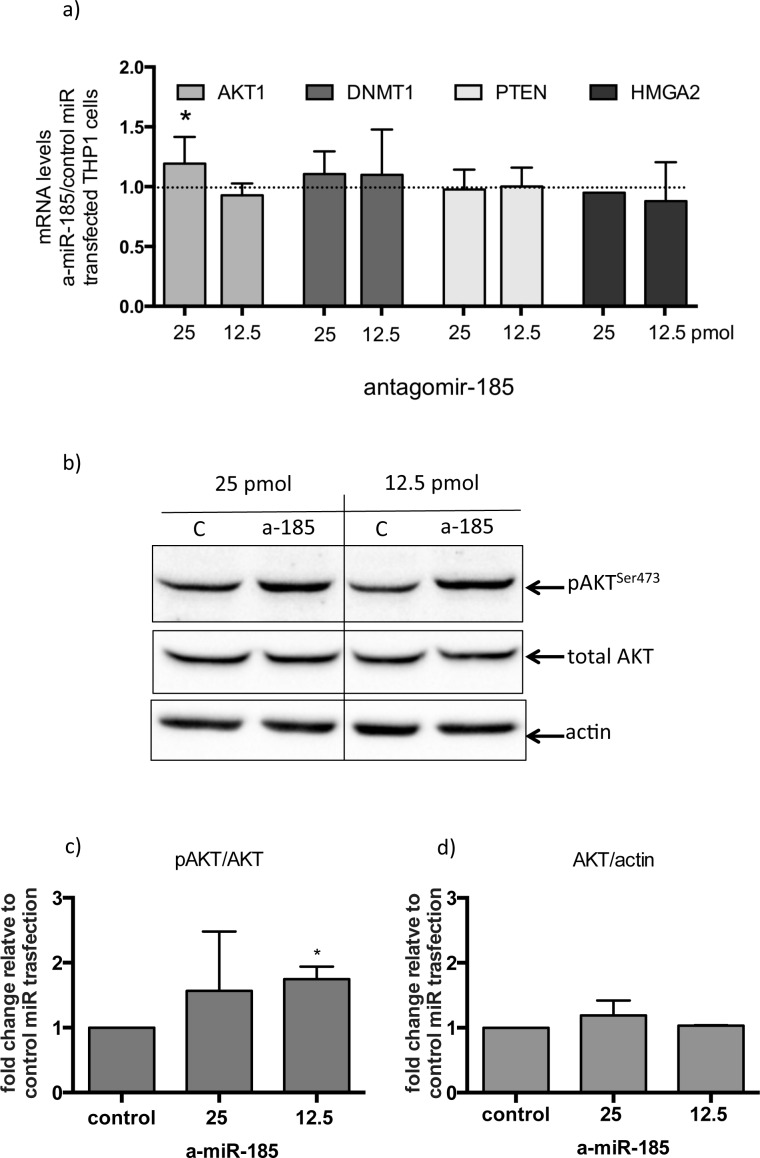
Figure 4. Inhibition of miR-185 in THP-1 cells treated with PMA, results in AKT activation.
a) fold changes in expression of AKT1, DNMT1, PTEN and HMGA2 mRNA in 25 or 12.5 pico-molar concentrations of antagomiR-185 RNA transfected THP1 cells relative to control transfection. (*:p<0.05 of one sample t-test). b) pAKTser473 and total AKT1 protein levels in 25 or 12.5 pmol concentrations of control miR (c) and antagomiR-185 (a-185) transfected THP1 cells. c) and d) Densitometry analysis of three independent transfection experiments of pAKTser473 relative to total AKT1 and total AKT relative to actin respectively. (*:p<0.05 of one sample t-test). Boxes represent mean and error bars are standard deviations

