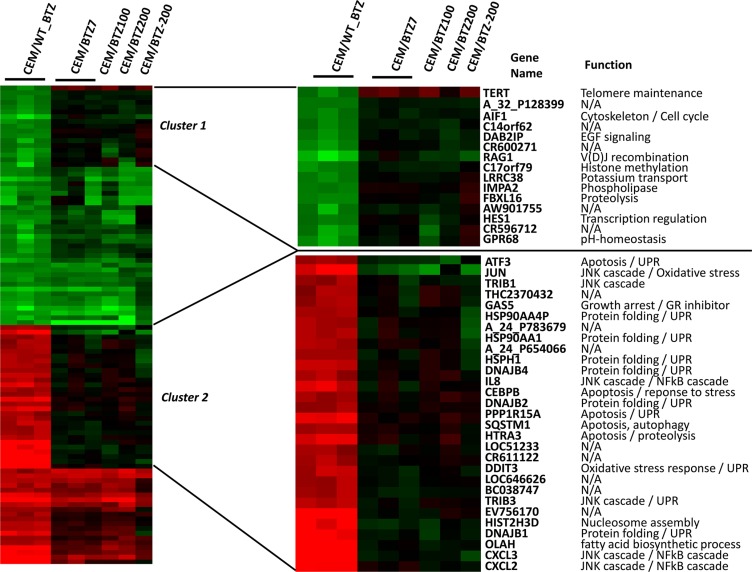
Figure 2. Top 50 upregulated and top 50 significantly down-regulated genes (p < 0.05) comparing CEM/WT_BTZ (CEM/WT cells incubated for 24 hrs with 7 nM BTZ) to CEM/BTZ7 (CEM cells resistant to 7 nM BTZ).
The figure depicts this selection of genes for all CEM variations as a ratio of the untreated CEM/WT cells. (Clustering performed using Cluster 3.0) An overview of top 50 upregulated and top 50 down-regulated genes is depicted. For genes in cluster 1 and cluster 2, gene annotation and function are provided.

