Figure 4.
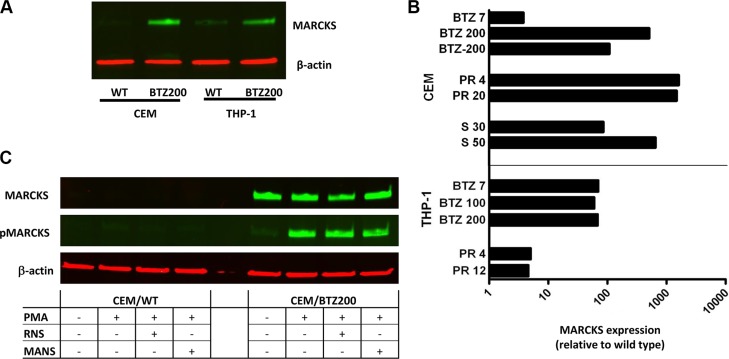
(A) MARCKS protein expression of CEM and THP-1 cells and their BTZ resistant sublines CEM/BTZ200 and THP-1/BTZ200. In addition, the CEM/BTZ200 cultured in absence of BTZ for several months (CEM/BTZ-200) is also included. Western blot analysis of MARCKS (green) and β-actin (red) as a loading control, (B) Ratio of the quantification of MARCKS protein expression (β-actin normalized) of proteasome inhibitor (PR924 and Marizomib) resistant THP-1 and CEM cells relative to their parental cells. (C) Basal levels of phosphorylated MARCKS expression in CEM/WT and CEM/BTZ cells before and after incubation with PMA (50 nM for 1 hour,), and a combination of PMA and RNS (1 hour 100 nM) or MANS (1 hour 100 μM).

