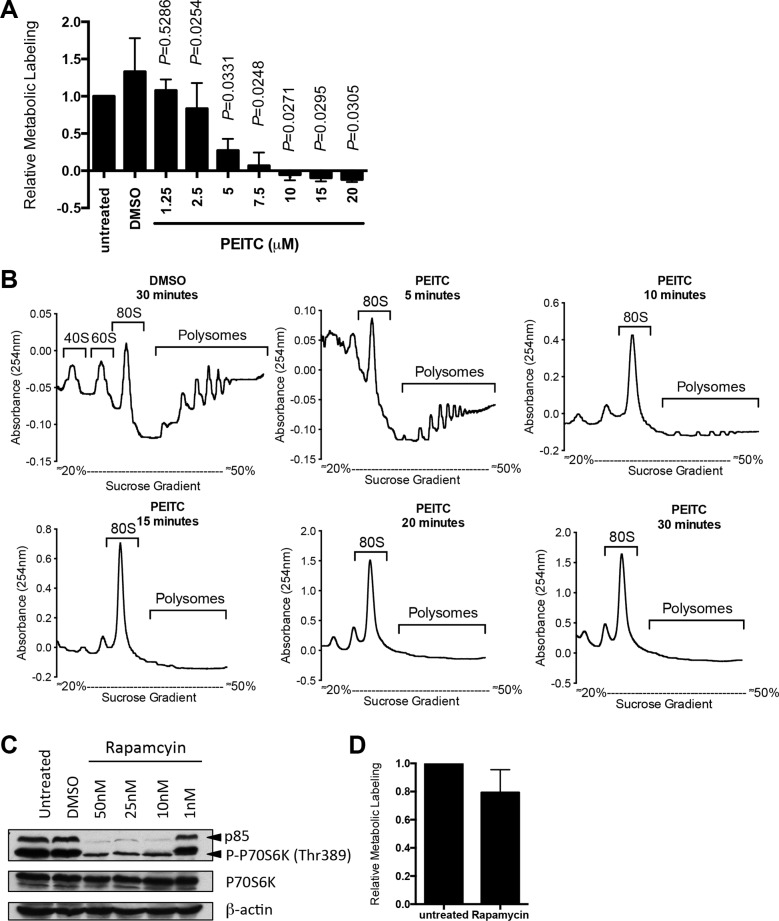
Figure 1. PEITC inhibits global mRNA translation in MCF7 cells.
(A) MCF7 cells were incubated with the indicated concentrations of PEITC, DMSO (solvent control), or were left untreated as a control. After one hour, mRNA translation was quantified using metabolic labeling. Graph shows means (± SEM) derived from three independent experiments, each performed in duplicate, with values for untreated cells set to 1.0. Statistical significance of differences between PEITC and DMSO treated cells is shown (Student's t-test). (B) MCF7 cells were incubated with PEITC (20 μM) or DMSO as a control. After the indicated times, polysome profiling was performed. The position of 80S and polysomes are indicated. Data are representative of three separate experiments. (C) MCF7 cells were treated with the indicated concentrations of rapamycin, DMSO, or were left untreated as a control. After three hours, expression of total and phosphorylated p70S6K and β-actin (loading control) was analyzed using immunoblotting. Experiment shown is representative of three independent experiments. (D) MCF7 cells were incubated with rapamycin (25 nM) or left untreated as a control. After one hour, mRNA translation was quantified using metabolic labeling. Graph shows means (± SEM) derived from duplicate determinations, with values for untreated cells set to 1.0.

