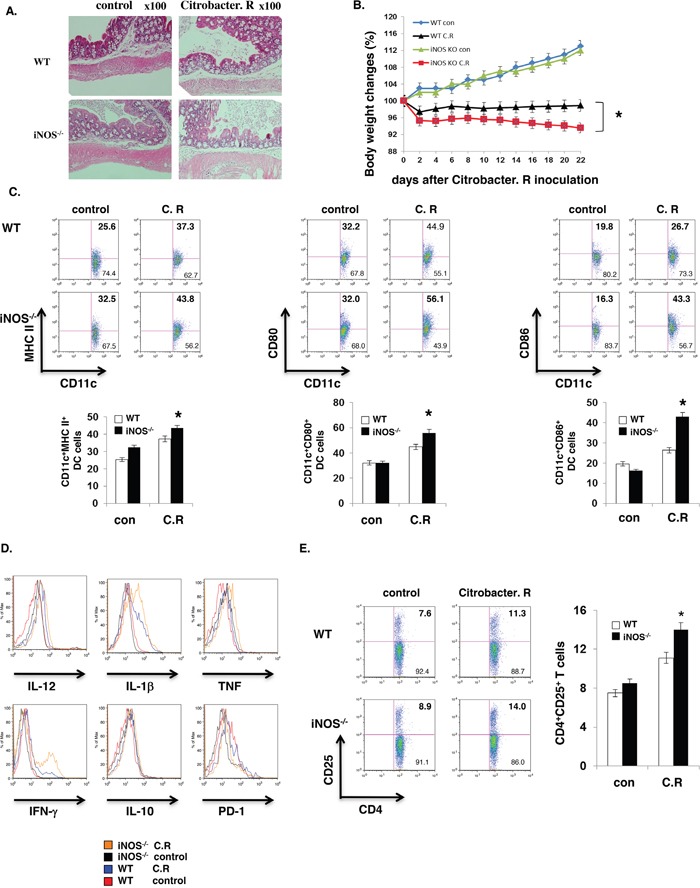
Figure 5. iNOS suppress effector DC differentiation in vivo.

WT or iNOS−/− mice were fed orally with Citrobacter Rodentium. Colon tissues with H&E staining were showed as A, B. Body weights of WT or iNOS−/− mice which were fed orally with Citrobacter Rodentium were balanced every two days. C. Maturation markers in CD11b+CD11c+ cells of mesenteric lymph node of WT or iNOS−/− mice which were fed orally with Citrobacter Rodentium as in (A) and were analyzed by FACS. D. Effector/stimulatory DC markers in CD11b+CD11c+ cells of mesenteric lymph node of WT or iNOS−/− mice which were fed orally with Citrobacter Rodentium as in (A) and were analyzed by FACS. E. T cell activation marker CD25 expression in CD4+ T cells of mesenteric lymph node of WT or iNOS−/− mice which were fed orally with Citrobacter Rodentium as in (A) were analyzed by FACS. Data represent mean ± SD. * P<0.05. **P<0.01.
