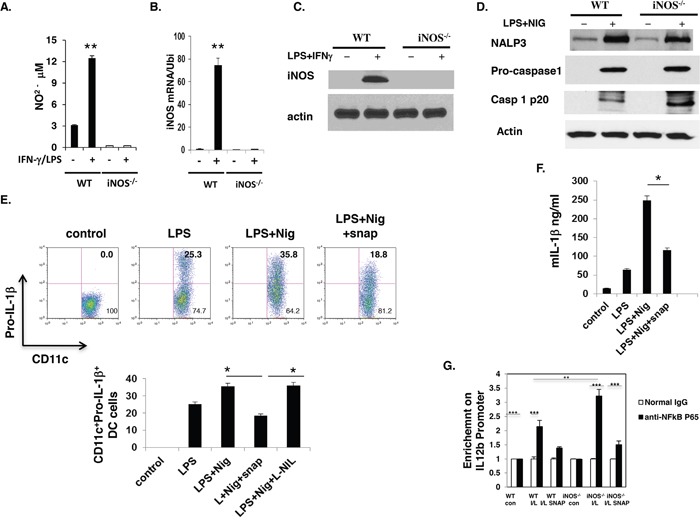
Figure 6. iNOS expression was induced in WT dendritic cells and NO suppress inflammasome activity.

Bone marrow cells from WT and iNOS−/− mice were cultured with GM-CSF (10ng/ml) and IL-4 (10ng/ml) for 7 days, then stimulated with IFN-γ (10ng/ml) plus LPS (100ng/ml) for 24 h. A. NO release in culture supernatant were analyzed. And B. total RNA was prepared in (A) and iNOS mRNA expression was analyzed by qPCR. C. The cell lysates prepared in (A) were prepared and western blotting was performed for the analysis of iNOS protein expression in these cells. D. Bone Marrow cells from wild type mice were cultured with GM-CSF and IL-4 for 7 days, and then stimulated with LPS for 5 h before stimulation with 20μM Nigericin for 30 min. To evaluate the effect of NO, the indicated concentration of SNAP or L-NIL were added to the cell culture 30 min prior to stimulation with nigericin. The cells lysate were prepared and western blotting was performed for the evaluation of inflammasome activity in BMDC cells. E. The cells prepared in (D) Pro-IL-1β expression in CD11b+CD11c+ cells was analyzed by FACS. And F. IL-1β in culture supernatant was analyzed. G. BMDCs from WT and iNOS−/− mice were stimulated with IFN-γ (10 ng/ml) and LPS (200 ng/ml) in the presence of SNAP (500 μM) or L-NIL (40 μM) overnight, followed by ChIP assay. Three micrograms of an anti-NF-kB p65 antibody or isotype-matched IgG as control antibody were used in the immunoprecipitation step. PCR was used to quantify the amount of precipitated DNA with primers flanking the p65-binding site of the IL-12 promoter region. Each bar represents mean ± S.D. from three independent experiments, unpaired Student's t-test, *P<0.05, versus WT cells.
