Figure 4.

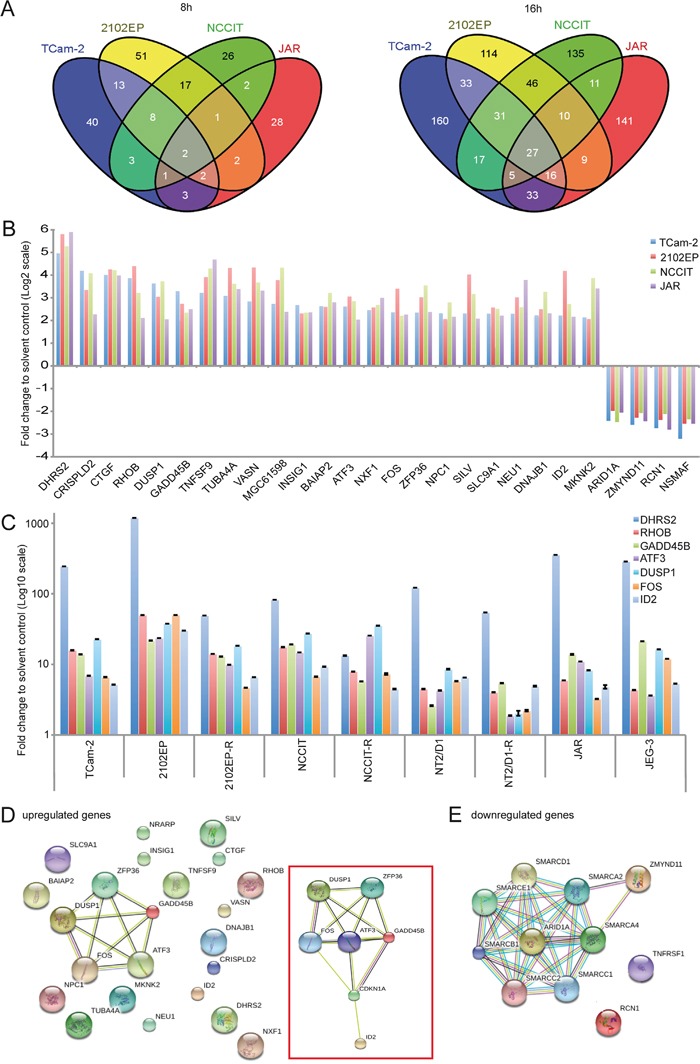
A. Venn diagrams of commonly expressed genes between GCC cell lines 8 and 16h after romidepsin treatment as found by expression microarray analysis. B. Expression levels of the 27 commonly deregulated genes (23 upregulated, 4 downregulated) in GCC cell lines. C. qRT-PCR verification of selected deregulations in romidepsin treated (16h) GCC cell lines. D, E. STRING protein-protein-interaction prediction of the 23 upregulated genes (D) and 4 downregulated genes (E). An extended network, including CDKN1A is illustrated in the red box (D).
