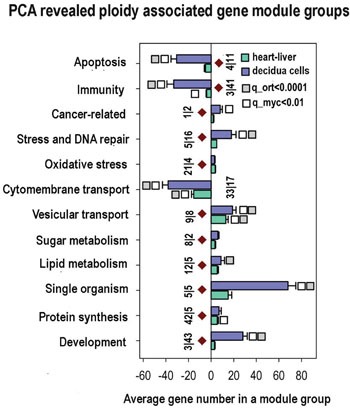
Figure 3. Common ploidy associated changes in gene functional module groups for heart-liver and 4n/2n decidua cells revealed by PCA.

X axis - average gene number in a module group. Y axis - module functional group names. Figures at the bottom of the bars indicate module number in a functional group. Small vertical bar divides figure for heart-liver and for 4n/2n decidua cells. White and grey squares reflect geometrical mean for q values of module functional group enrichment significance with regard to all Myc targets (white squares) and with regard to all orthologs (grey squares). Bars with no squares have q-value not less than 0.15 with regard to all Myc targets and not less than 0.05 with regard to all orthologs. Module groups confirmed by gene-by-gene analysis are marked with brown diamonds.
