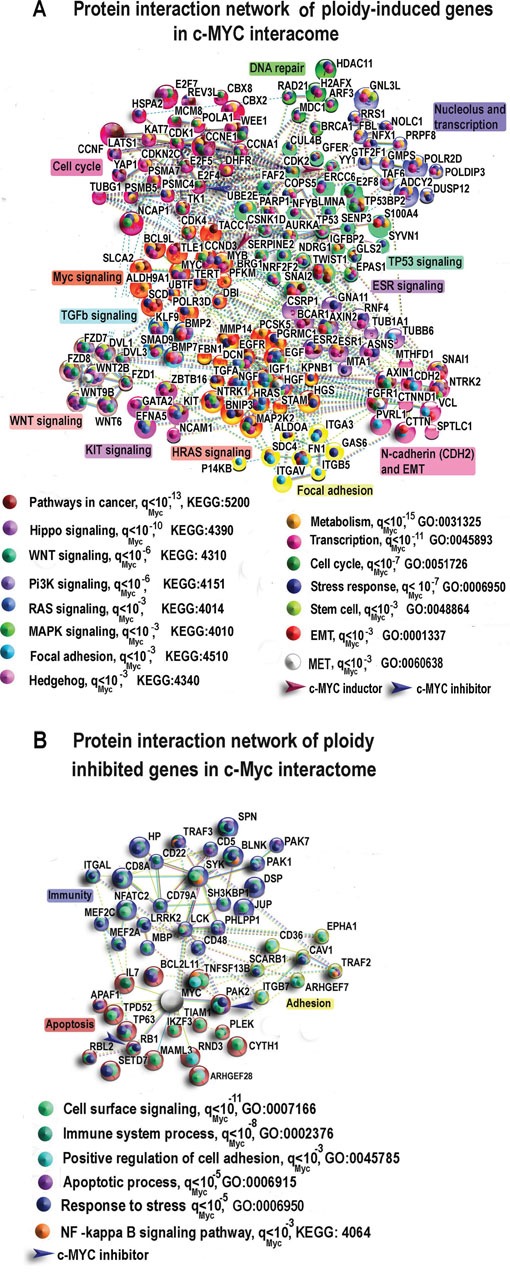
Figure 4. The most connected components of protein interaction networks of significantly ploidy- induced A. and ploidy-inhibited B. genes in the c-Myc interactome of heart, liver and placenta revealed by gene-by-gene cross-species comparisons of human and mouse heart and liver and 4n/2n mouse decidua cells.

Large symbols show genes with more than two-fold expression differences between polyploid vs diploid organs and cells. Brown and blue arrows show direct c-MYC inductors and inhibitors that were determined with the use of String Server (molecular interaction type option). Clustering was performed by MCL algorithm with the use of the same server. qMyc presents q value for GO biological processes and KEGG pathways enrichment of tested gene sample compared to all c-Myc interactants.
