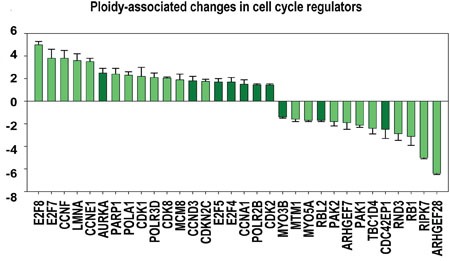
Figure 6. Ploidy-associated changes in the activity of regulators related to cell cycle.

X- gene names; Y-average expression for heart-liver and placenta±SE. Bars of light colors correspond to p<0.0001; Bars of dark colors correspond to p<0.01. This chart shows the increased activity of cell cycle regulators related to G1-S transition (CCNA1, E1, D3, F; CDK2, 8; E2F4, 5,) S-phase (POLA1, PARP1, REV3L, MCM8, TK), polyploidization (E2F7, 8) G2-M genes (AURKA1) and decreased activity of genes involved in cytokinesis (ARHGEF28, ARHGEF7, CDC42EP1, MTM1, MYO5A, MYO3B, RIPK7, CAV1) and tumor supressors (RB1, RBL2, PAK1, PAK2).
