
Figure 8. Ploidy-associated regulators of epithelial-to-mesenchymal transition (EMT) and pluripotency.
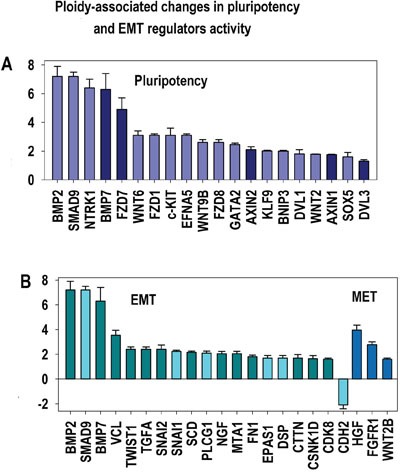
X- gene names; Y-average expession for heart-liver and placenta±SE. Bars of light colors correspond to p<0.0001; Bars of dark colors correspond to p<0.01. This chart shows the increased activity of principal regulators related to selfrenewal (A) and EMT (B) increasing ploidy proclivity for transformation.