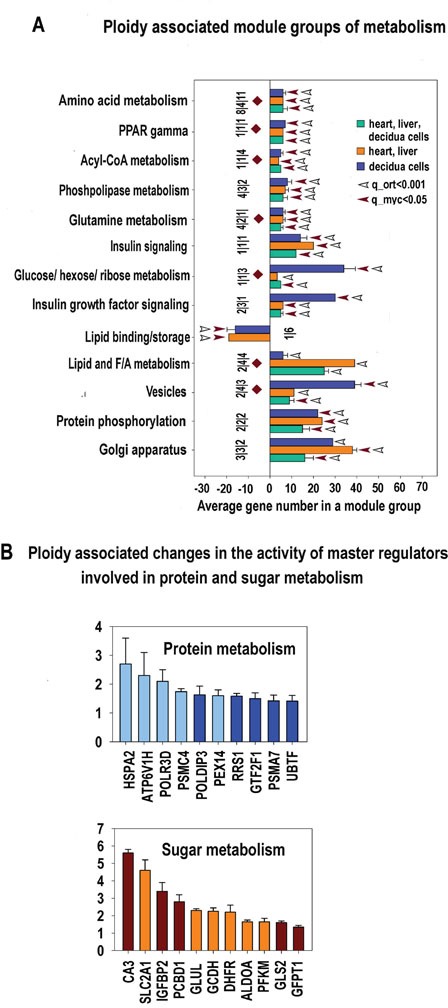
Figure 9.

A. Metabolism related modules significantly enriched in ploidy-regulated genes from all three c-Myc interacting gene lists (for heart-liver, placenta and heart-liver-placenta). Designations for X, Y, figures at the bottom of the bars, red and white arrows pointing to the tips of the bars, bars with no arrows and red diamonds are the same as for Figure 5. This chart indicates that polyploidy is linked to metabolism activation and modification. Specifically, it outlines the boosting of various branches of protein metabolism and transport, induction of sugar metabolism and insulin signaling and the switch of the lipid metabolism from biosynthesis to decomposition. This switch is seen from impaired modules of lipid binding and storage and induced modules related to phospholipase, Acyl-CoA metabolism and PPAR gamma modules. B. Ploidy-associated metabolic regulators common for heart-liver and placenta. X- gene names; Y-average expession for heart-liver and placenta±SE. Bars of light colors correspond to p<0.0001; Bars of dark colors correspond to p<0.01. This chart shows the increased activity of sugar and protein metabolism inherent for increased activity of growth processes.
