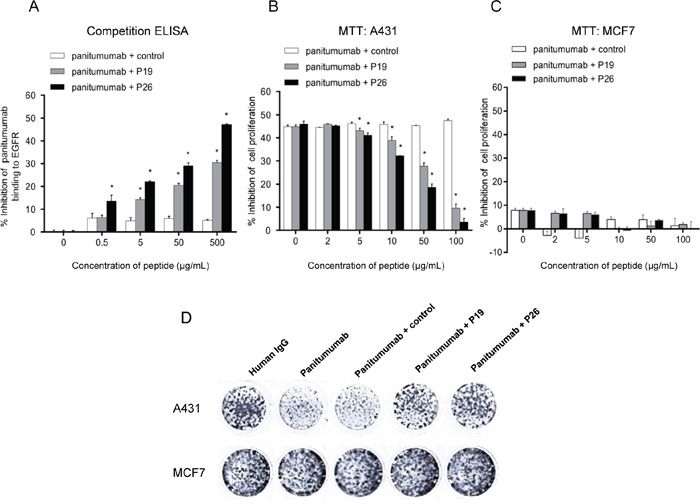
Figure 2. Peptides P19 and P26 inhibited the function of panitumumab.

A. ELISA assays demonstrated P19 and P26 inhibited the binding of panitumumab to EGFR. Percentage of inhibition was calculated as follows: (ODpanitumumab - ODpanitumumab with peptide) ×100%/ODpanitumumab. B. MTT assay suggested that P19 and P26 blocked the effect of panitumumb on inhibition of cell proliferation in A431 cells, but not in MCF7 cells C. Percentage of inhibition was calculated as follows: (ODhuman IgG - ODpanitumumab with peptide)×100%/ODhuman IgG. Data are shown as the mean OD values (±SDs) of 3 independent experiments performed in triplicate. Statistically significant differences are indicated. *, P < 0.05. D. Colony formation assay of A431 and MCF7 cells cultured in the presence of panitumumab with or without peptides.
