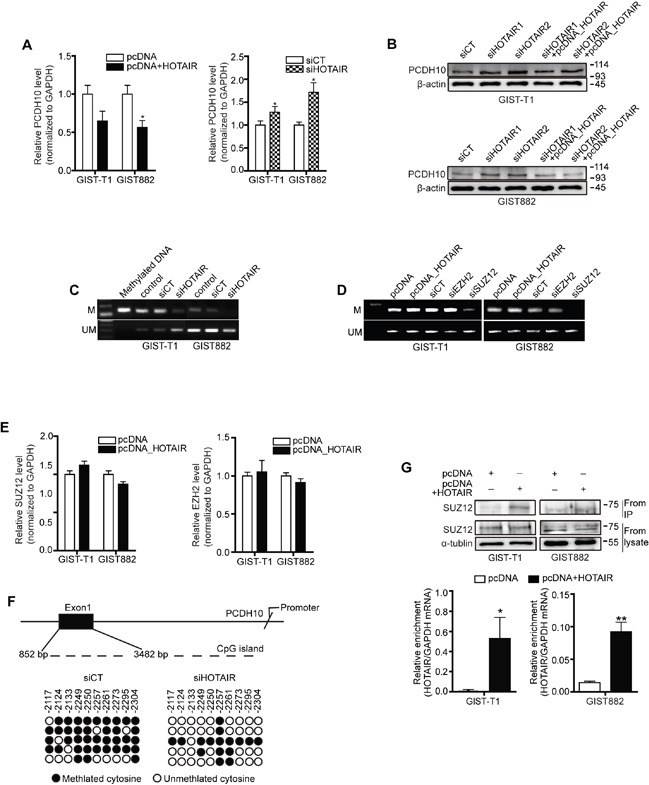
Figure 3. HOTAIR controls the methylation of PCDH10.

PCDH10 expression was measured in GIST-T1 and GIST882 cell lines after treatment with pcDNA-HOTAIR (A.; left panel), and in GIST882 cells after treatment with siHOTAIRs (A, right panel). The data shown are representative of three independent experiments. The bars represent relative PCDH10 mRNA levels. B. PCDH10 protein level was determined via Western blot in GIST-T1 and GIST 882 cells. C. The methylation of PCDH10 after treatment with siHOTAIRs was measured via MS-PCR. D. The methylation of PCDH10 was measured after treatment with siEZH2 or siSUZ12. M, methylated DNA; UM, unmethylated DNA. E. mRNA of SUZ12 and EZH2 was measured via qRT-PCR after transfection of pcDNA-HOTAIR. NS: not significant. F. DNA from GIST-T1 treated with siCT or siHOTAIRs was treated with bisulfite, and the promoter regions in axon 1 were amplified by PCR and cloned. Each circle represents a CpG and filled ovals indicate methylation. Open ovals indicate un-methylation. G. The interaction between SUZ12 and HOTAIR was confirmed via RIP analysis. The bars present relative enrichment. Data are expressed as mean ± SEM. The asterisk denotes a statistically significant difference compared to pcDNA or scrambled control (*P ≤ 0.05, **P ≤ 0.01).
