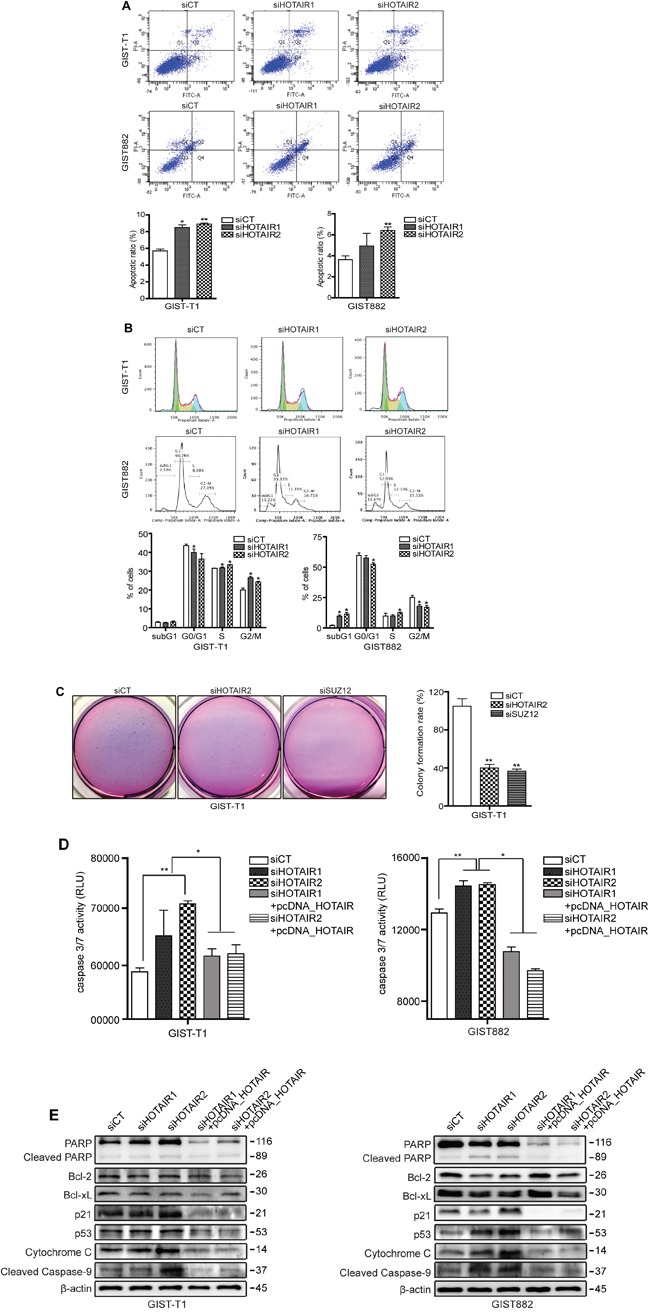
Figure 5. siHOTAIRs induce apoptosis and cell cycle arrest.

GIST-T1 and GIST882 cells were transfected with siCT or siHOTAIRs. Apoptosis and cell cycle analysis were performed using PI/Annexin-V A. and PI B. staining. The bar represents ratio of apoptotic phase (A) and percentage of cells (B). siHOTAIR1 and siHOTAIR2 were compared to scrambled control (siCT). C. Soft agar colony formation was performed after treatment with siHOTAIRs or siSUZ12. The bar represents the rate of colony formation. siHOTAIR2 and siSUZ12 were compared to scrambled control (siCT). D. A caspase -3 and -7 assay was measured via ELISA after treatment with siCT, siHOAIRs or pcDNA-HOTAIR. siHOTAIR1 and siRHOTAIR2 were compared to scrambled controls (siCT). siHOTAIR1+pcDNA-HOTAIR and siHOTAIR2+pcDNA-HOTAIR were compared to siHOTAIR1 and siRHOTAIR2, respectively. E. Apoptotic and cell cycle markers were detected in transfected GIST cells via Western blot. Data shown are representative of three independent experiments (*P ≤ 0.05; **P ≤ 0.005).
