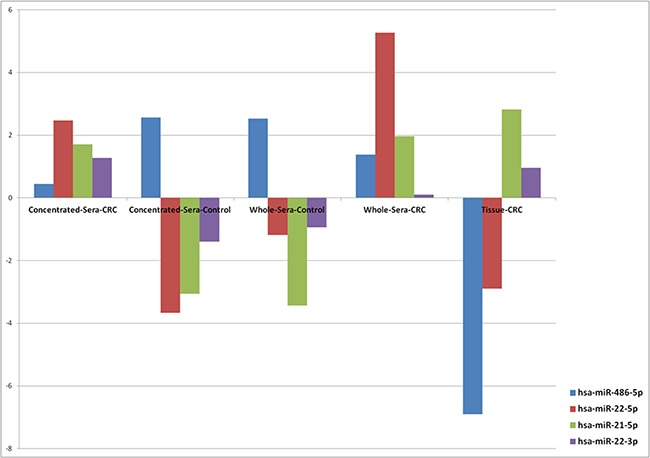
Figure 3. Expression trends of miRNAs in serum and CRC tissue samples.

This figure shows examples of the results of ANOVA analysis of four miRNA candidates across five different sample types. Common low expression of miR-486-5p (P-value, 3.39×10⁻³²) and upregulation of miR-21-5p (P-value, 1.64×10⁻¹⁰) were observed in CRC. A “strand-specific” expression was observed for miR-22.
