
Figure 1. Cetuximab modulates macrophage polarization in an AOM/DSS mouse model.
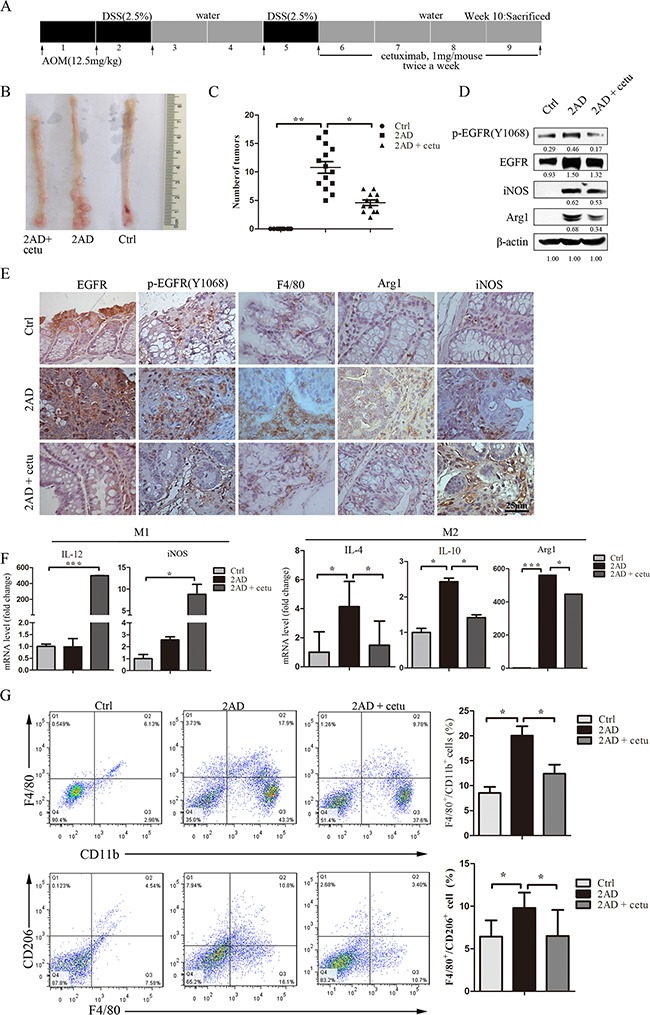
A. Establishment of the AOM/DSS mouse model. AOM was injected intraperitoneally at 12.5 mg/kg body weight. After one week, mice were given drinking water containing 2.5% DSS for 5 days followed by 16 days of regular drinking water. After two cycles of DSS treatment, cetuximab (1 mg/mouse, twice a week) was injected intraperitoneally for a month, and the mice were then sacrificed. B. Representative images of colon tumors in normal (right), AOM/DSS (2AD) (middle), and cetuximab-treated AOM/DSS mice (2AD+cetu) (left). C. Tumor quantification. Cetuximab treatment (2AD + cetu) reduced tumor numbers compared to 2AD mice. D. p-EGFR (Y1068), EGFR, Arg1, and iNOS protein levels in normal mice, 2AD and 2AD+cetu mouse tumors were detected by Western blot. All experiments were repeated three times. E. Representative photomicrographs of immunostaining for p-EGFR (Y1068), PCNA, F4/80, Arg1, and iNOS. Scale bars: 25 μm. F. M1 marker (IL-12, iNOS) and M2 marker (IL-4, IL-10, Arg1) mRNA levels in normal mouse colon tissues, 2AD and 2AD+cetu mouse tumor tissues were evaluated by q-PCR. G. Percentages of CD11b+/F4/80+ and F4/80+/CD206+ cells in normal, 2AD, and 2AD+cetu mice colon tissues were detected by flow cytometry. Colon tissues were cut into small pieces (1-2 mm) and incubated with collagenase D (1- mg/mL), dispase II (1 mg/mL), and DNase I (100 μg/mL) for 30-45 min in a shaking incubator at 37°C, and single-cell suspensions were then incubated with antibodies. Bars represent means ± SD (n = 3) for each treatment. *p < 0.05; **p < 0.01; ***p < 0.001.