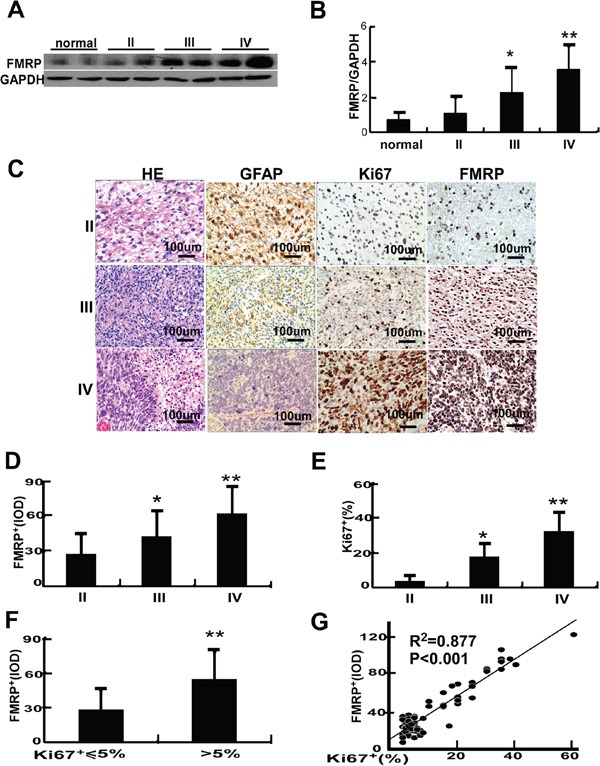
Figure 1. The expression of FMRP in astrocytoma tissues.

A. Representative image showing the detection of FMRP by western blot in brain tissue samples from patients with astrocytomas of varying pathologic grades (II, III or IV) or cerebral trauma (controls). GAPDH was used as a loading control. B. Mean data showing the expression of FMRP (relative to that of GAPDH) in brain tissue samples from patients with astrocytoma (grade II, III or IV) or cerebral trauma (controls). Bars correspond to the mean ± SD. * P<0.05, **P<0.01 vs. both the controls and grade II groups. C. Representative microscopy images showing brain tissue sections from patients with astrocytoma (grade II, III, or IV) stained with H&E or immunostained for GFAP, Ki67, or FMRP. D. FMRP+IOD values measured from immunostained brain tissue sections from patients with astrocytoma (grade II, III, or IV). Bars correspond to the mean ± SD. * P<0.05, ** P<0.01 vs. the grade II group. E. Percentage of Ki67+ cells measured from immunostained brain tissue sections from patients with astrocytoma (grade II, III, or IV). Bars correspond to the mean ± SD. * P<0.05, ** P<0.01 vs. the grade II group. F. FMRP+ IOD data grouped according to the percentage of Ki67+ cells (≤5% or >5%). Values are presented as the mean ± SD. ** P<0.01 vs. Ki67+ ≤5% cells. G. Correlation between FMRP+ IOD and percentage of Ki67+ cells in astrocytoma tissue.
