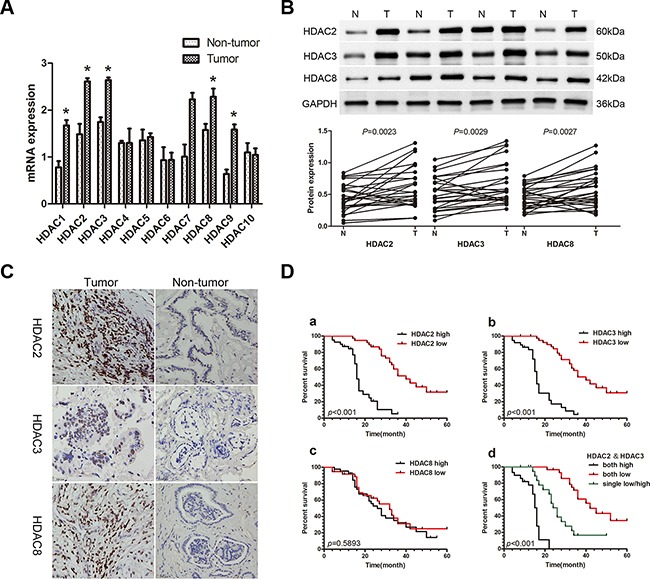
Figure 1. Expression of HDACs in patients with CCA and the correlation of the HDAC2/3 expression with poor prognosis.

A. qRT-PCR was used to measure the expression of class I and class II HDACs in 26 paired CCA and non-tumor tissue samples. Total RNA was isolated from at least three samples of each tissue and ACTB was used as the internal control. Fold changes were calculated through relative quantification (2−ΔΔCt). Data are shown as mean ± SD, *P<0.05. B. Western blot was used to detect protein expression of HDACs 2, 3, and 8. GAPDH was used as the internal control and all experiments were repeated three times. A representative image is shown (upper panel), and the statistical analysis of the relative optical density of each band is shown (lower panel). *P<0.05. C. Representative IHC staining of HDACs 2, 3 and 8 in CCA tissues and paired adjacent non-tumor tissue (400X). Scale bar, 100μm. D. Kaplan-Meier analysis. a. Patients with low HDAC2 expression (n=37) had longer overall survival (OS) than patients with high HDAC2 expression (n=42; median OS: 40 months vs 16 months, P<0.001, log-rank test). b. Patients with low HDAC3 expression (n=35) had longer OS than patients with high HDAC3 expression (n=44; median OS: 43 months vs 17 months, P<0.001, log-rank test). c. There were no differences in OS between the low HDAC8 expression group (n=37) and the high HDAC8 expression group (n=42; median OS: 32 months vs 26 months, P=0.5893, log-rank test). d. Patients with lower expression of both HDAC2 and HDAC3 (n=21) had a longer OS than patients with higher expression of both HDAC2 and HDAC3 (n=22), or low expression of either HDAC2 or HDAC3 (n=36; median OS: 42 months vs 16 months vs 25 months, P<0.001, log-rank test).
