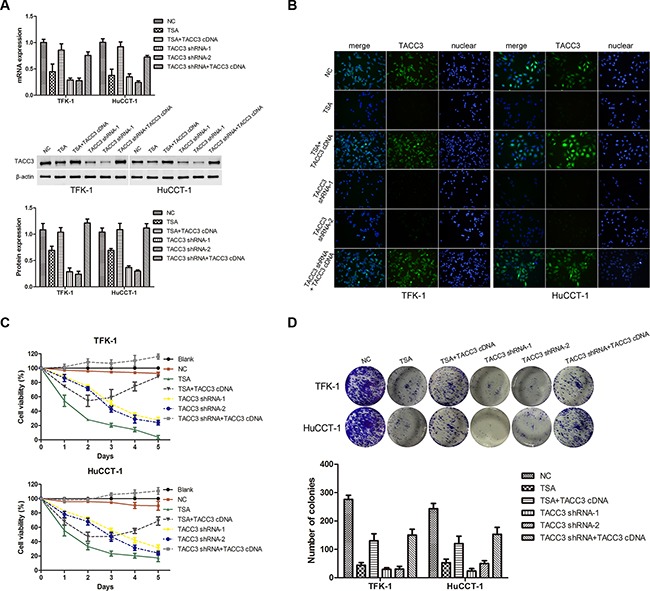
Figure 4. Knockdown of TACC3 suppresses proliferation and colony formation of CCA cells.

TFK-1 and HuCCT-1 cells were treated with TSA or small interfering RNAs as indicated, and empty vector was used as the negative control (NC). A. qRT-PCR and western blot assays were used to detect the expression of TACC3. For WB analysis, representative imagines are shown (middle panels). Statistical analysis of the relative optical density of each band is shown (lower panels). β-actin was used as an internal control, experiments were repeated three times, and data are shown as mean ± SD, *P<0.05. B. Immunofluorescence was used to detect the expression of TACC3 (green). DAPI (blue) was used to stain the nuclei. The fluorescence intensity of TACC3 was stronger in NC groups, and was weaker in cells treated with TSA or transfected with shRNA. In the TACC3 shRNA rescue experiment, fluorescence intensity was recovered. One representative experiment out of the three performed is shown (400X). C. Survival rate of TFK-1 and HuCCT-1 cells was detected by CCK-8 assay. Experiments were repeated three times and data are shown as mean ± SD. D. Colony formation assays were performed to evaluate the proliferative capability of TFK-1 (upper panel) and HuCCT-1(lower panel) cells. A representative image is shown, and a statistical comparison of the indicated groups was performed across three independent experiments, *P<0.05 and **P<0.001.
