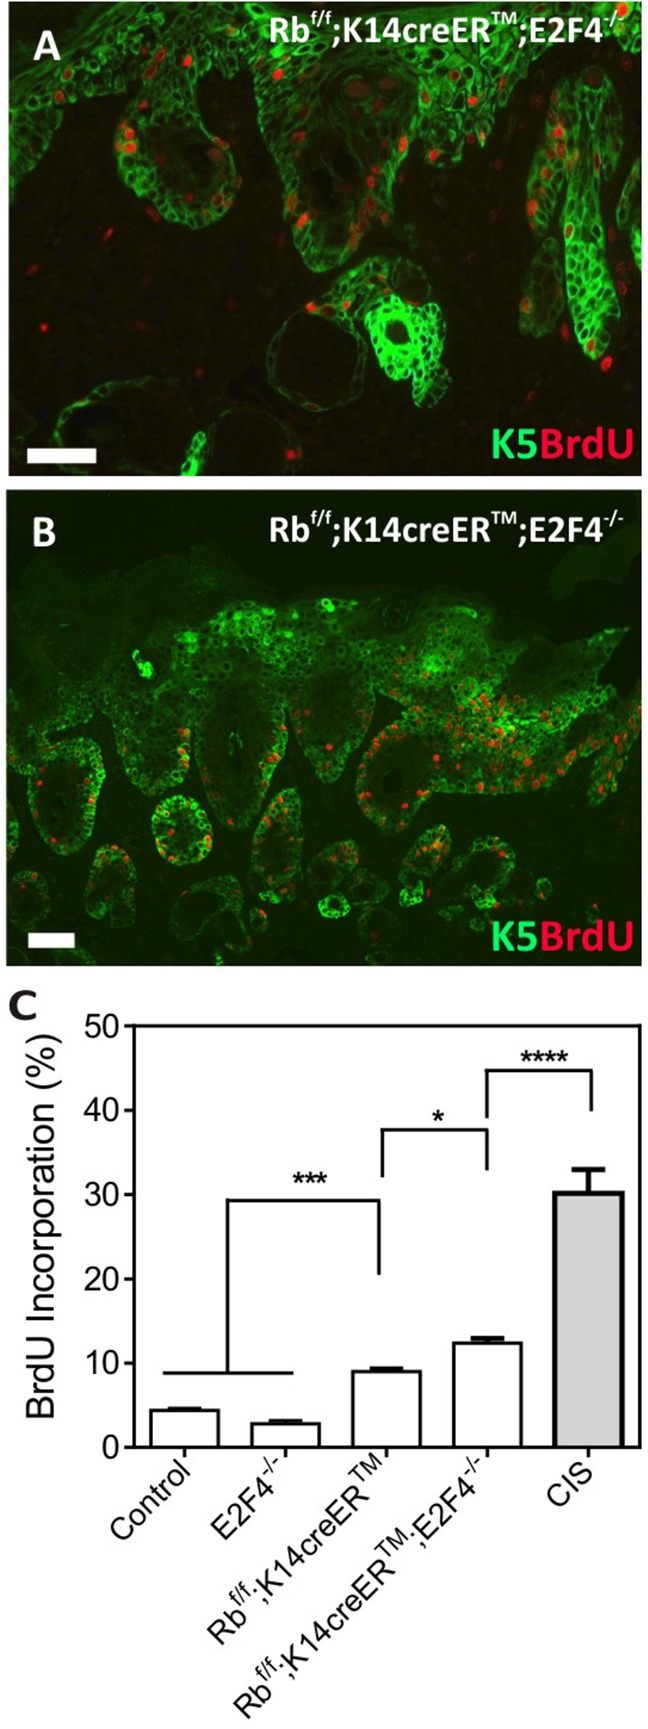
Figure 4. Epidermal Proliferation in RbF/F;K14creERTM;E2F4−/− mice.

A, B. Double immunofluorescence showing the expression of K5 (green) and BrdU (red) incorporation in the RbF/F;K14creERTM;E2F4−/− epidermis (A) and in carcinoma in situ areas (B). Bars=150 μm C. Quantitative analysis of BrdU incorporation in epidermis of the quoted genotypes. Data come from at least three mice per genotype scoring three different sections per mouse; data are shown as mean±s.e. (p values are denoted by asterisks: * p<0.05, *** p<0.005, **** p<0.0001 analyzed by unpaired Mann-Whitney t Tests).
