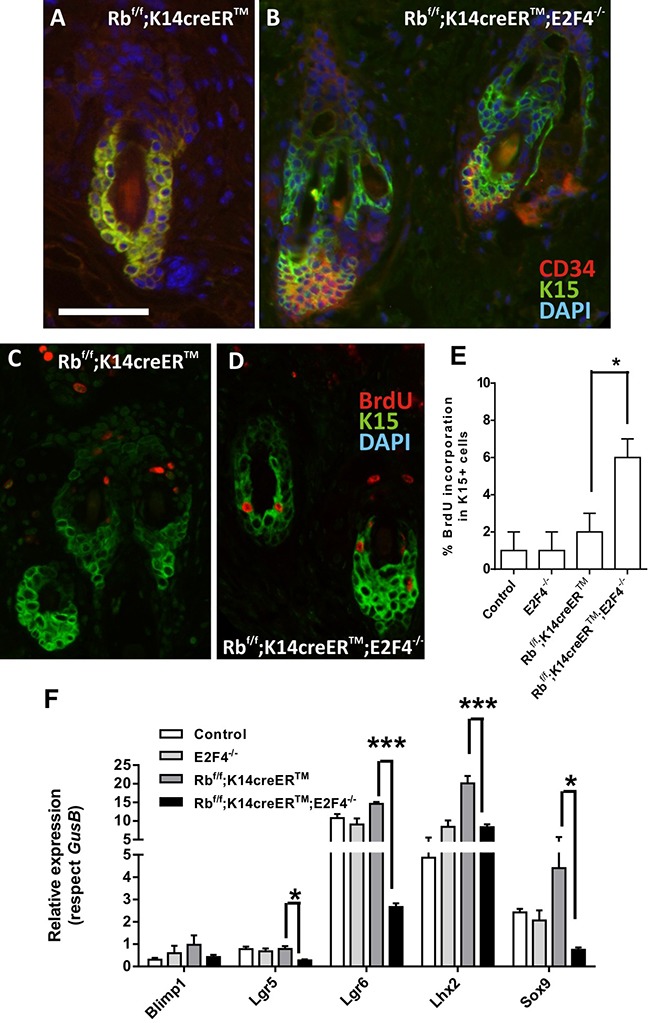
Figure 5. Epidermal stem cell niche is altered in RbF/F;K14creERTM;E2F4−/− mice.

A, B. Representative double immunofluorescence images showing the expression of the cell stem markers K15 (green) and CD34 (red) in hair follicles of RbF/F; K14creERTM (A) and RbF/F;K14creERTM;E2F4−/− (B) respectively. Nuclei were stained with DAPI (blue). C-D. Double immunofluorescence showing BrdU incorporation (red) in the K15 positive cells (green) in RbF/F;K14creERTM (C) and RbF/F;K14creERTM;E2F4−/− (D) epidermis. Bars= 150 μm E. Quantitative analysis of BrdU incorporation in K15+ cells of the quoted genotypes. Data come from at least five mice per genotype scoring three different sections per mouse and are shown as mean±s.e. F. Quantitative analysis of the relative expression of different genes involved in epidermal stem cells homeostasis (Lgr5, Lgr6, Blimp1, Lhx2 and Sox9) in the quoted genotypes (n=6) using qRT-PCR. GusB gene was used as a control for normalization. Samples come from total skin and are shown as mean±s.e.m. (p values in E, F are denoted by asterisks: * p<0.05, *** p<0.005 analyzed by unpaired Mann-Whitney t Tests).
