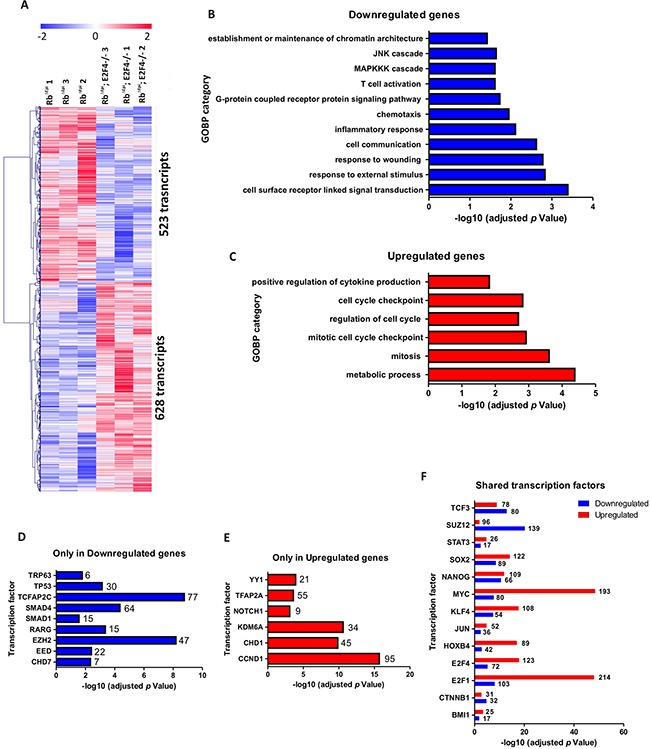
Figure 7. Genome-wide transcriptome comparison between Rbf/f;K14creERTM;E2F4−/− and Rbf/f;K14creERTM skin.

A. Heatmap of the microarray analyses showing 523 transcripts upregulated and 628 transcripts downregulated in Rbf/f;K14creERTM;E2F4−/− compared to Rbf/f;K14creERTM skin. B, C. Enrichment analyses of Gene Ontology of the downregulated (B) and upregulated (C) genes. D, E. ChEA analyses showing the transcription factors exclusively regulating the downregulated (D) and upregulated genes (E). F. ChEA analyses showing the transcription factors involved in the regulation of both upregulated and downregulated genes.
