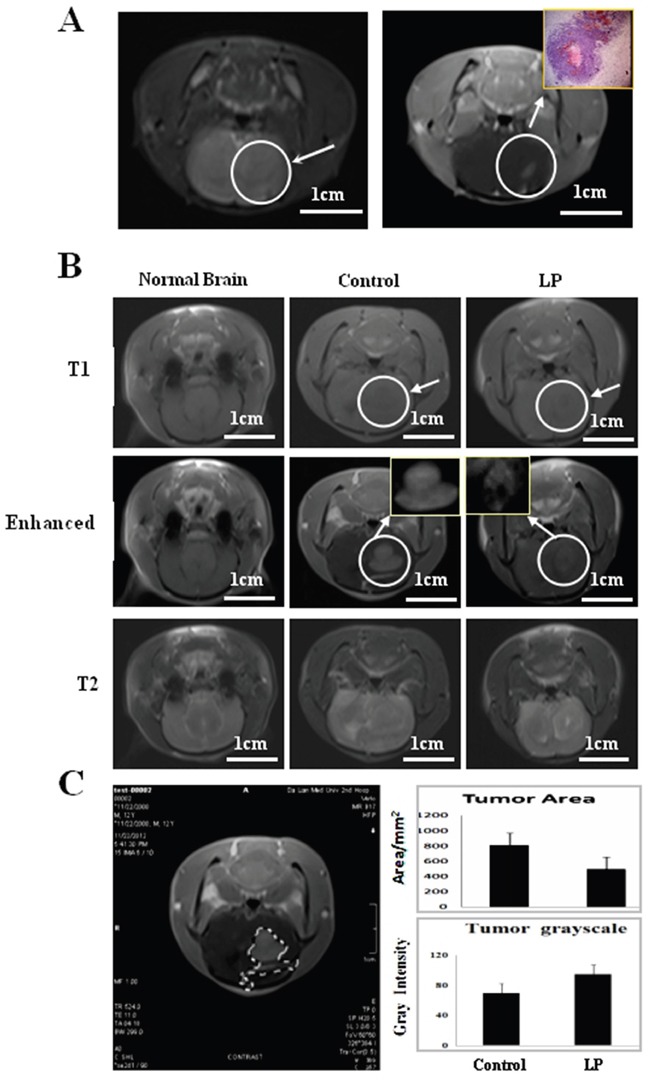
Figure 3. Monitoring tumor growth by magnetic resonance imaging (MRI).

A. Left side: Conventional MRI imaging at Day 3 after transplantation, the arrow indicates the inoculation region. Right side: Enhanced imaging and the corresponding pathological finding (Inset) at Day 3 after intracranial transplantation. B. MRI 9 days after drug treatment. The arrow indicates the tumor location with higher magnification in the insets. C. Tumor areas were measured using Adobe Photoshop CS4. Average tumor area and gray intensity were determined according to area calculation performed on the tumor marked out from the MRI of the two experimental groups.
