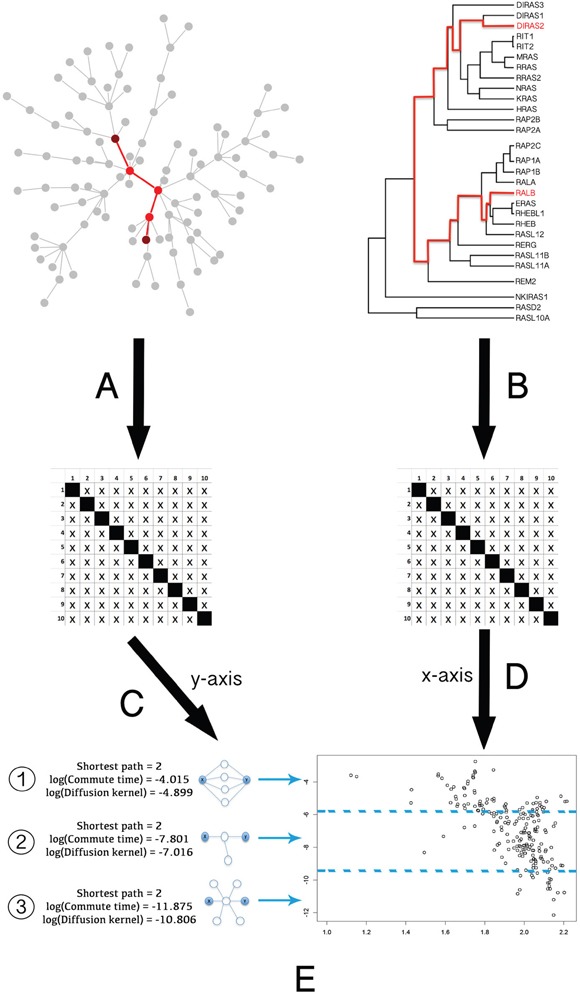
Figure 2. General pipeline of the Ras protein pairs phylogenetic and network distance measurements and comparison.

A. Pairwise distance calculation in the PPI graph, expressed as a matrix. B. Pairwise phylogenetic distance calculation in the tree, expressed as a matrix. C. Logarithmical transformation to normalize network distances between proteins. D. Exponential transformation to normalize phylogenetic distances between proteins. E. Graphical representation of both the proteins phylogenetic and network distances. As we can see in the left side of E, distance measures based on kernels (e.g. DK or CT), compared to shortest path calculation (minimum number of edges connecting two given nodes), are able to distinguish the level of association between two Ras nodes connected through different topologies: 1) highly connected nodes; 2) low connected; 3) nonspecifically connected. This result demonstrates that kernel similarity metric is one of the better measures to deal with the kind of artifacts produced by highly connected network hubs (see section 1 in Supplementary material).
