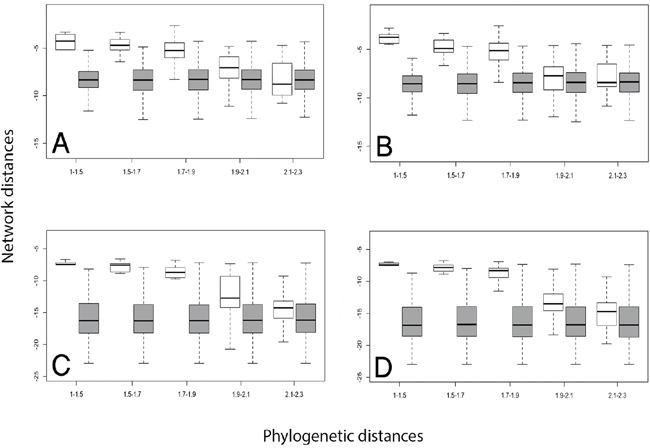
Figure 3. Distributions of network distance values between protein pairs in different phylogenetic distance bins.

Real (white boxes) and random (dark boxes) normalized distributions of the network distances between Ras protein pairs (y-axis), divided into bins corresponding to rising ranges of normalized phylogenetic distances (x-axis). Network distances were calculated applying CT (panels A and B) and DK (panels C and D) algorithms for the STRING Experimental (panels A and C) and the PINA (panels B and D) PPI graph datasets.
