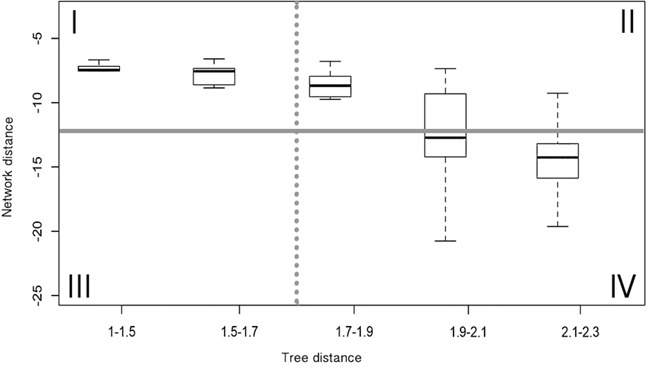
Figure 4. Distribution of the network vs phylogenetic distance values and established thresholds.

Example of the comparison between normalized phylogenetic distances and normalized network distances between protein pairs, applying DK algorithm to STRING Experimental dataset for obtaining network distances. The phylogenetic distance threshold corresponds to pairs with 45% sequence identity (dashed line) and network closeness threshold is established according to a p-value of 0.05 (solid line).
