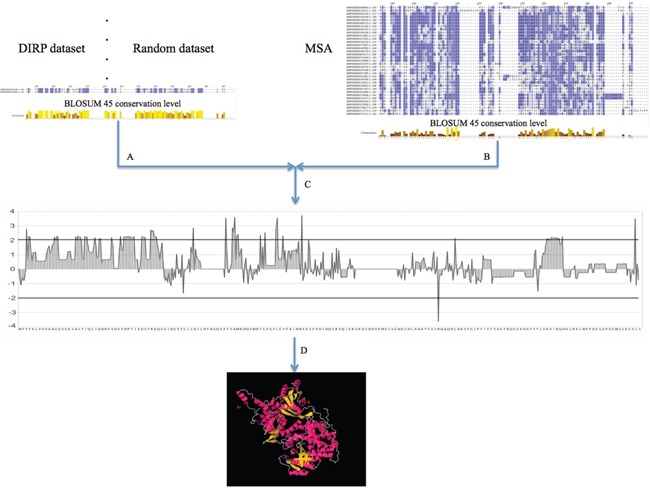
Figure 5. General pipeline for obtaining the set of DIRP specific positions and mapping them into Ras 3D complexes.

A. Position conservation measurement using the BLOSUM 45 matrix for the pairs selected as DIRP and for the randomly selected pairs (negative control). B. Position conservation measurement within the whole MSA. C. Differential position conservation (normalization) between both (the DIRP and random datasets) versus the MSA background. D. Selection of the significant DIRP specific positions and mapping on the different human Ras 3D binding complexes.
