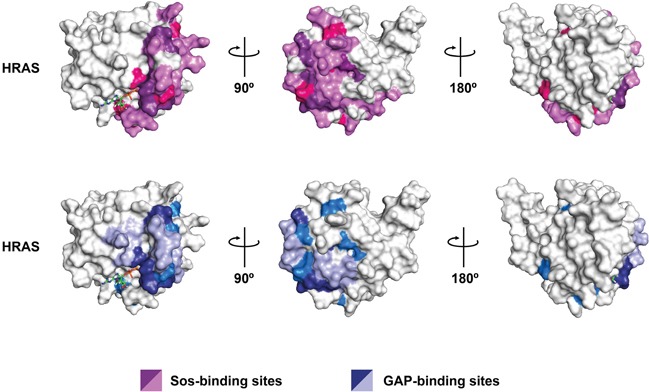
Figure 7. Spatial distribution of all DIRP in HRAS protein.

Relevant residues are positioned on a surface model for the 3D structure of the human HRAS paralog (pdb# 1aa9). Upper row: residues involved in the interaction of HRAS with the GEF Sos are in light purple while those DIRP involved in the interaction are in dark purple. DIRP not involved in the HRAS-Sos interaction are in pink. Lower row: residues involved in the interaction of HRAS with the GAP are in light blue while those DIRP involved in the interaction are in dark blue. DIRP not involved in the HRAS-GAP interaction are in marine blue. Note that both common and specific DIRP positions can be identified following this approach. For clarity, three rotating views are shown for each HRas protein.
