
Figure 7. Common and differential expression changes in transcription and epigenetics associated genes in responses to Trastuzumab and Pertuzumab alone or in combination of.
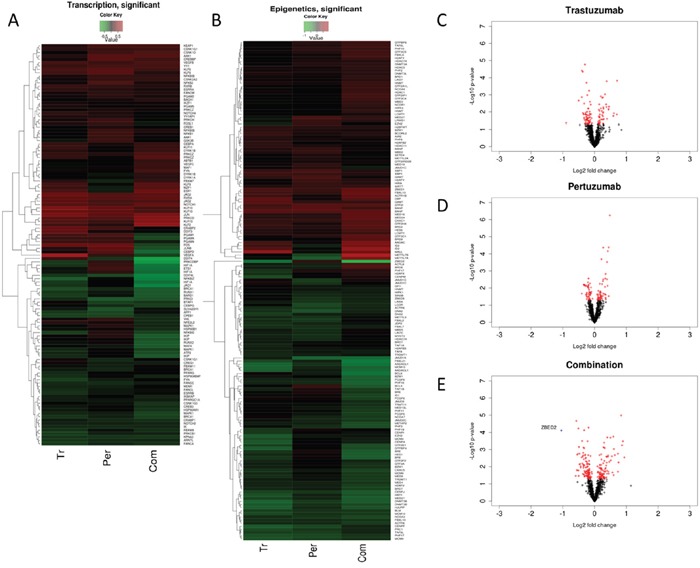
(A) Heatmap showing differential changes (B) Heatmap showing significant (p≤0.05) differential changes in the expression of the genes relative to control treatment of SKOV3 ovarian xenograft tumors (SAM FDR=10%) as in References [15, 48]. Red represents increased expression and green decreased expression relative to the median of the controls. (C, D) Volcano-plots showing gene expression changes in transcription and epigenetics associated genes following trastuzumab (C), pertuzumab (D), and their combination (E) treatment of the SKOV3 xenograft tumors. The genes with significant (p ≤ 0.05) and non-significant fold changes are colored red and black, respectively, and some genes with a high fold change are marked by blue crosses.