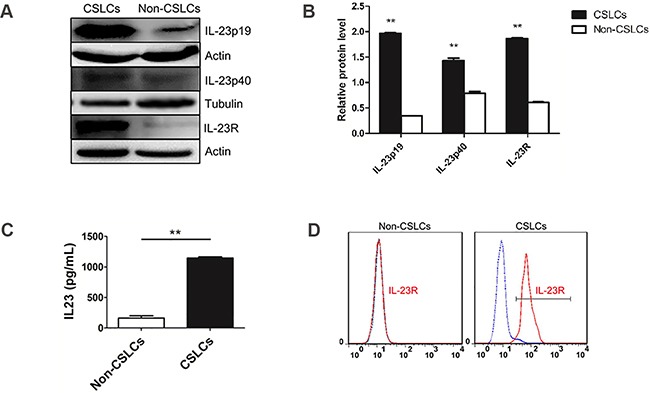
Figure 1. IL-23 and IL-23R expression in ovarian CSLCs.

A. Western blot analysis of levels of IL-23p19, IL-23p40 subunit and IL-23R in CD133− and CD133+ cells, derived from A2780 cells. B. Quantification of expression data shown in (A). Data were expressed as as means ± S.D. **P < 0.01 vs. the CD133− cells group, C. IL-23p19 protein expression levels, as measured by ELISA, showing an increase in IL-23p19 protein production by CD133+ cells relative to CD133− cells. D. Flow cytometric analysis of IL-23R-expressing cells in A2780-derived CD133+ and CD133− cells.
