
Figure 9. Correlation between IL-23p19 expression and CD133, Nanog, Oct4 levels and degrees of differentiation in primary ovarian cancer tissue.
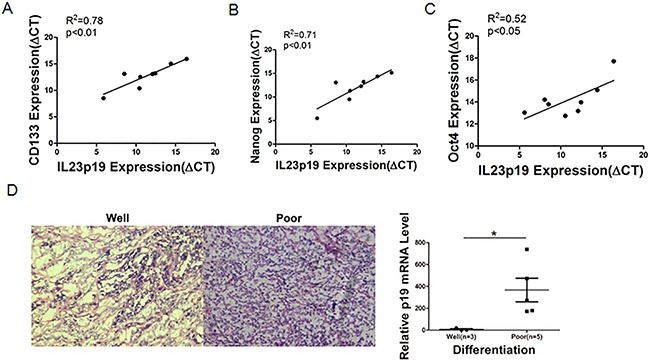
A-C. Correlation of gene expression levels between IL-23p19 and CD133, Nanog and Oct4 in primary samples, as measured by qRT-PCRn. D. Representative H&E staining of well and poor degrees of differentiation in primary samples (left panel) and its relationship with IL-23p19 levels. Experiments were performed three times and data were expressed as mean ± SD. *P<0.05.