
Figure 2. Biological pathways deregulated in erlotinib resistant HNSCC cells.
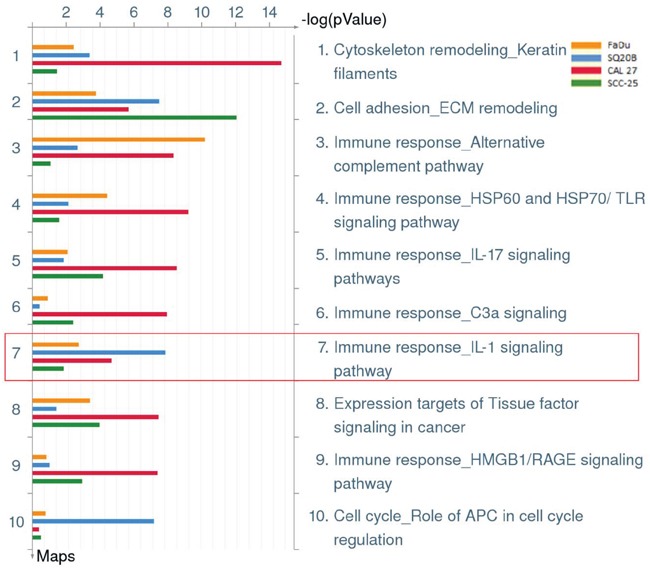
Shown are the top ten deregulated pathways from differentially regulated transcripts comparing microarray data from erlotinib-resistant FaDu (yellow bars), SQ20B (blue bars), CAL 27 (green bars), and SCC-25 (red bars) HNSCC cells as compared to their respective erlotinib-sensitive HNSCC cells. Enclosed in red box is pathway #7 which represents the IL-1 signaling pathway.