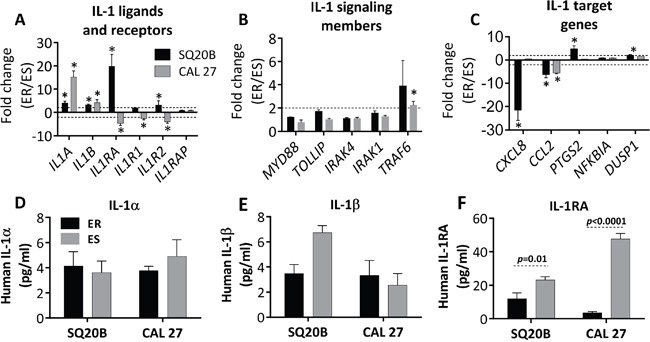
Figure 3. Validation of select IL-1 pathway genes in erlotinib resistant (ER) vs. erlotinib sensitive (ES) HNSCC cells.

Expression of IL-1 ligands and receptors A., signaling genes B., and select IL-1 target genes C. in ER- vs. ES- SQ20B and –CAL 27 cells were analyzed by quantitative RT-PCR. GAPDH or 18S was used as an endogenous control. Dotted horizontal lines indicate fold change of ±2. Secretion of IL-α D., IL-1β E., and IL-1RA F. in cell culture supernatants were analyzed by sandwich ELISA in ER- vs. ES- SQ20B and CAL 27 cells; and the concentrations were normalized to cell number. Fold change values were calculated by the anti-log of delta delta CT values (2^-delta delta CT values). * indicates significantly (fold change > +2 or < −2 and false discovery rate (FDR) < 0.05).
